- USD/TRY has recovered from the two-week low of 7.9876 reached Monday.
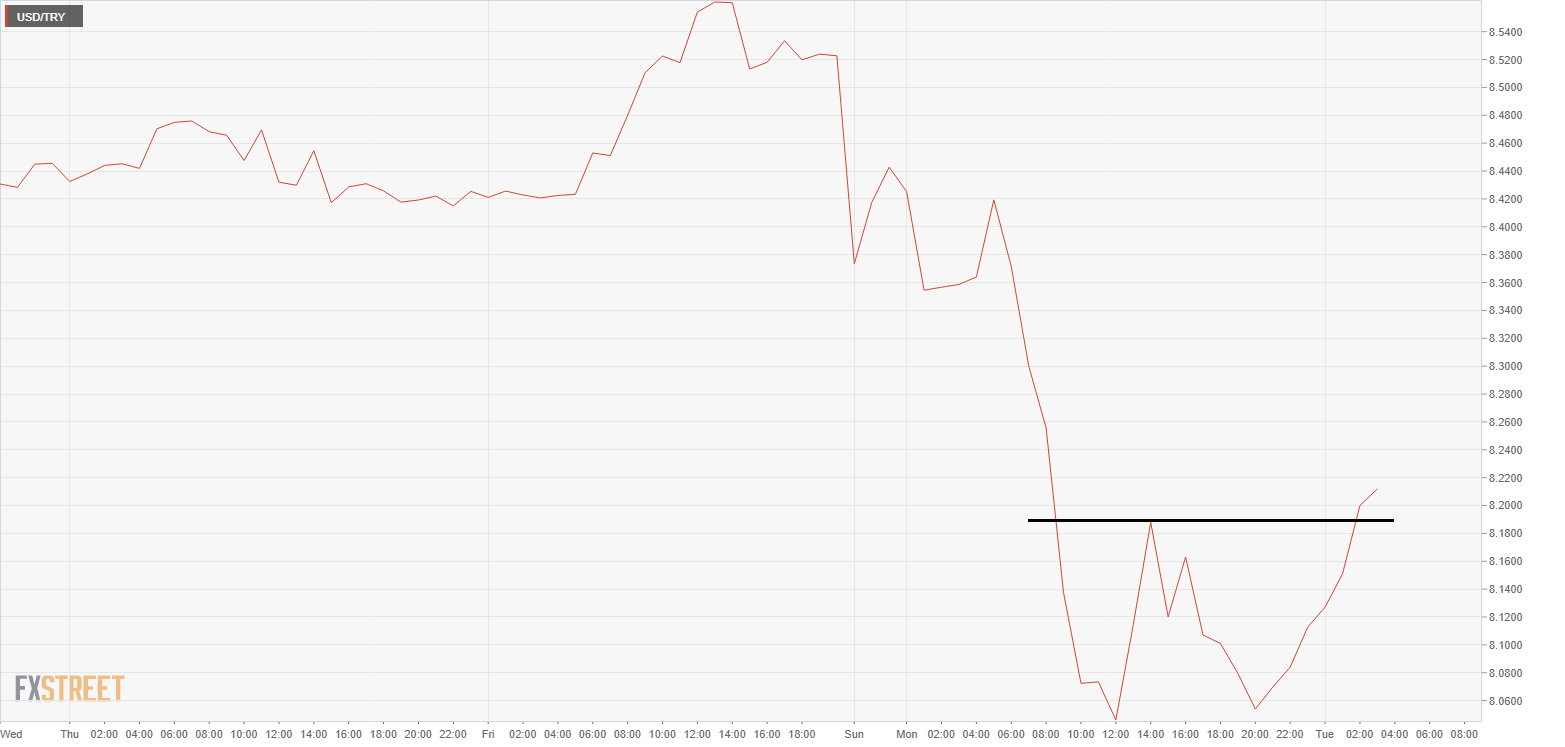
- The hourly chart shows a double bottom breakout.
USD/TRY is currently trading at 8.1956, representing a 1.92% gain on the day. The pair fell sharply on Monday to 7.9876, the lowest level since Oct. 26.
The hourly chart shows the pair has broken out of a double bottom pattern with a move above the neckline resistance at 8.1892. The breakout is backed by an above-50 or bullish relative strength index and rising MACD histogram, a sign of the strengthening of the upward momentum. As such, further gains, possibly toward 8.3651 (Nov. 4 low) may be seen.
However, if the double bottom breakout fails, stronger selling pressure may emerge, allowing a re-test of Monday’s low of 7.8976. Chart traders consider failed breakouts as powerful bearish signals.
Hourly chart
Trend: Bullish
Technical levels
Resistance: 8.3651 (Nov. 4 low), 8.5777 (Nov. 6 high)
Support: 7.9876 (Monday’s low), 7.8361 (50-day SMA)
