- AUD/JPY looks for a clear direction inside a bearish chart formation.
- MACD signals favor a downside move but an eight-day-old support line, 100-HMA can challenge the sellers.
- Bulls can aim for September 10 peak after defying the pattern.
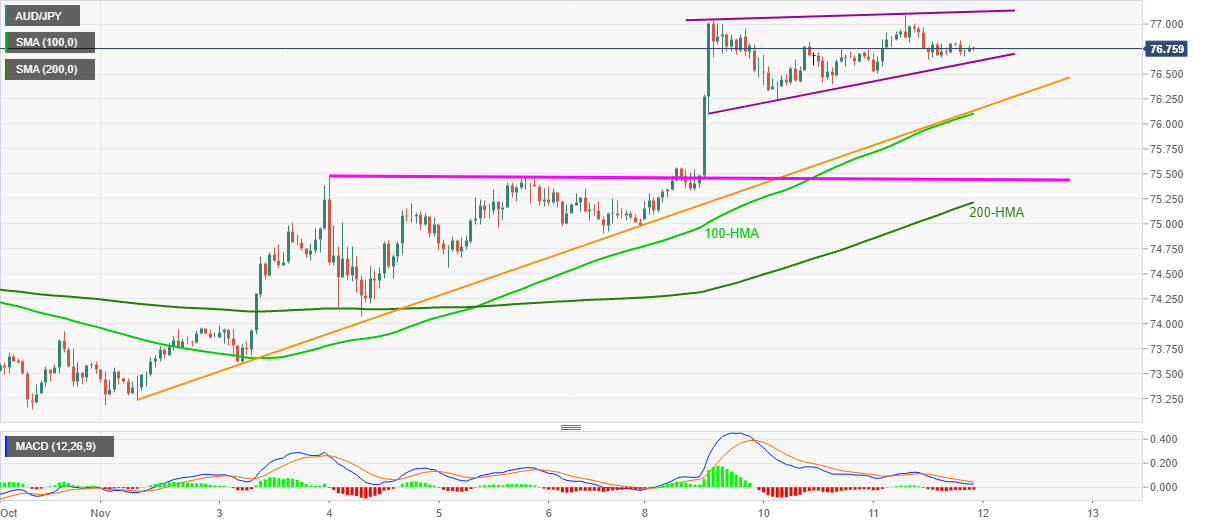
AUD/JPY seesaws near 76.75/70 during the early Thursday morning in Asia. In doing so, the pair stays inside a three-day-old ascending triangle formation.
Considering the bearish MACD signals, AUD/JPY is expected to confirm the downtrend-supporting chart play by declining below the 76.60 immediate support. However, a confluence of 100-HMA and an upward sloping trend line from November 02 will question the pair bears around 76.10 afterward.
In a case where the sellers dominate past-76.10, highs marked during the middle of last week, around 75.40/45 will be in the spotlight.
Meanwhile, AUD/JPY buyers are less likely to look for entries unless witnessing an upside break of the stated pattern’s resistance, at 77.12 now.
Following that, the September 10 high of 77.73 and the 78.00 threshold can offer intermediate halts during the north-run towards the August 31 peak surrounding 78.46.
AUD/JPY hourly chart
Trend: Pullback expected
