- AUD/USD bulls are tiring at resistance on the longer-term charts.
- Bulls are monitoring price action from support for the next bullish opportunity.
AUD/USD is meeting a key resistance area and starting to revert towards a support zone that could provide a trading opportunity.
The following is a top-down analysis that illustrates the price action and market structure across multiple time frames and where bulls will be looking to engage again.
Monthly chart
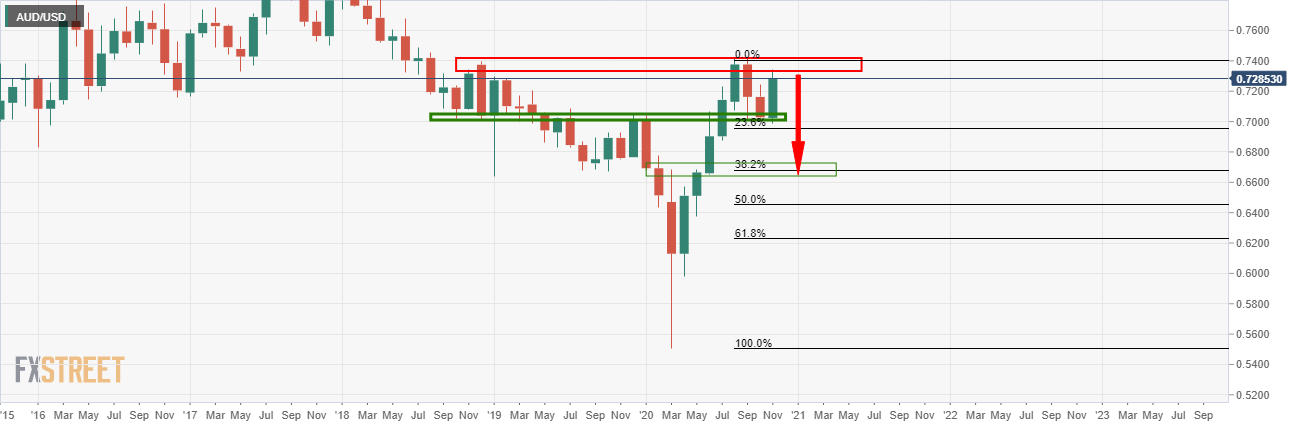
The monthly chart offers a bearish bias below the current support structure.
However, there is plenty of room for meanwhile opportunities between there and lower time frame market structures, as follows:
Weekly chart
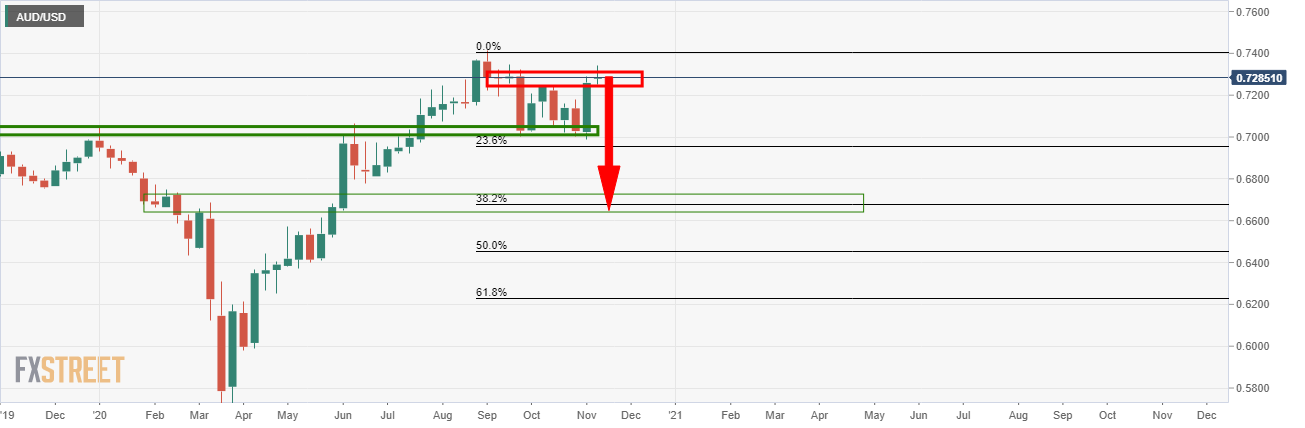
From a weekly perspective, the price is struggling to convince on the bid at resistance.
Daily chart
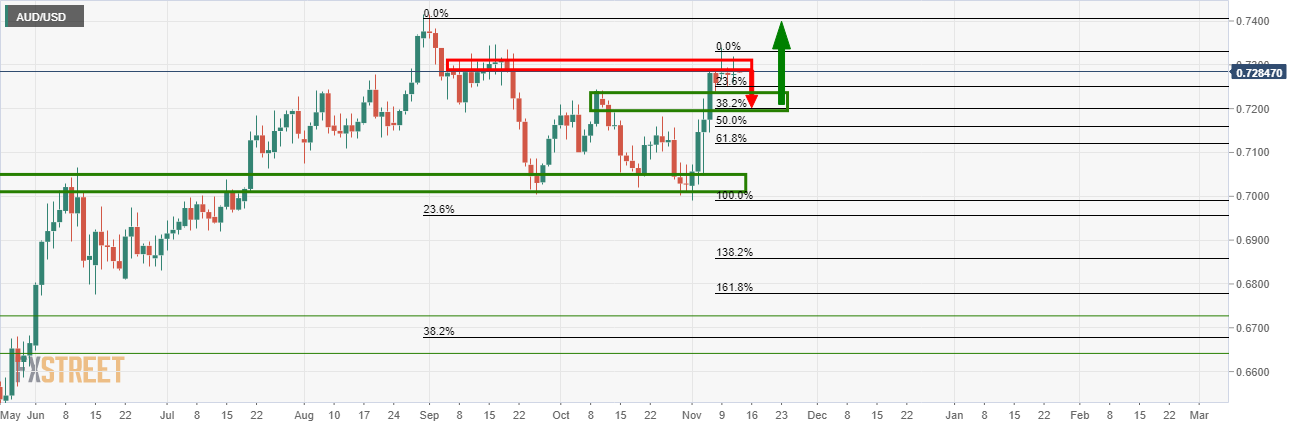
The daily chart shows that the 38.2% Fibonacci retracement target has a confluence with the mid-October highs which would be expected to act as a support.
4-hour chart
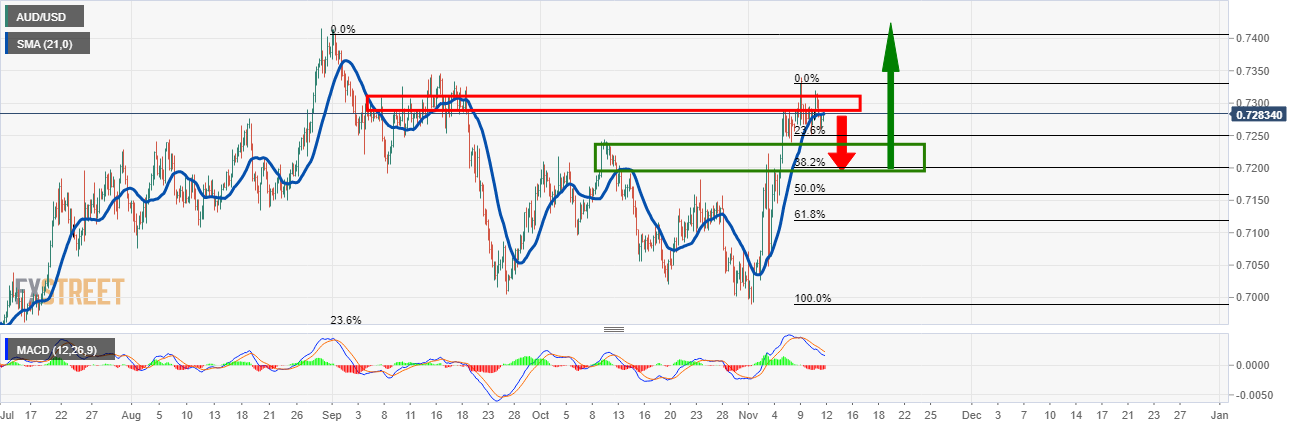
The bullish conditions are less convincing and the price is reverting towards the support area from where bulls will be monitoring for bullish structure and a longing opportunity.
If the price does indeed stall at support and commence a bullish trajectory again, this would be expected to be the next bullish impulse to target higher highs.
