- WTI bounces off weekly horizontal line, keeps support breakdown.
- Further upside will have key hurdles towards $44.00.
- Confluence of 200-bar SMA, ascending trend line from November 01 offers strong support.
WTI takes rounds to $41.75/80 during the early Thursday’s trading. In doing so, the energy benchmark extends corrective pullback after breaking an ascending support line from Monday, but staying above the immediate horizontal rest-line.
Considering the strong RSI conditions, not overbought, the black gold is again likely to attempt breaking the late-August highs of $43.86, by targeting the February 2020 low near $44.00.
However, the previous support line, currently around $43.20, preceding the recent high near $43.30 offers intermediate stops to the north-run.
Alternatively, a downside break of $41.55 nearby horizontal support can extend the declines towards a join of 200-bar SMA and a nine-day-old rising trend line, at $39.50 now.
During the fall, the $40.00 threshold could add buffers while last Thursday’s top adds strength to the stated support.
WTI four-hour chart
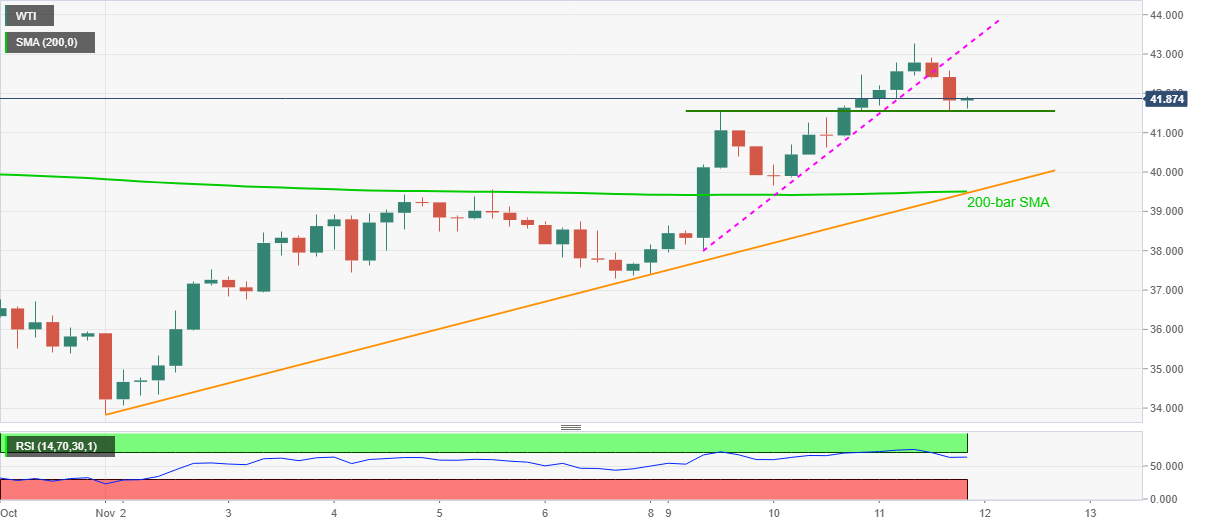
Trend: Bullish
