- USD/CAD trims early-Asian losses while battling the 200-HMA.
- RSI recovery suggests further upside, buyers await confirmation of the bullish pattern.
- Key Fibonacci retracements add to the support, 100-HMA offers an extra filter to the north.
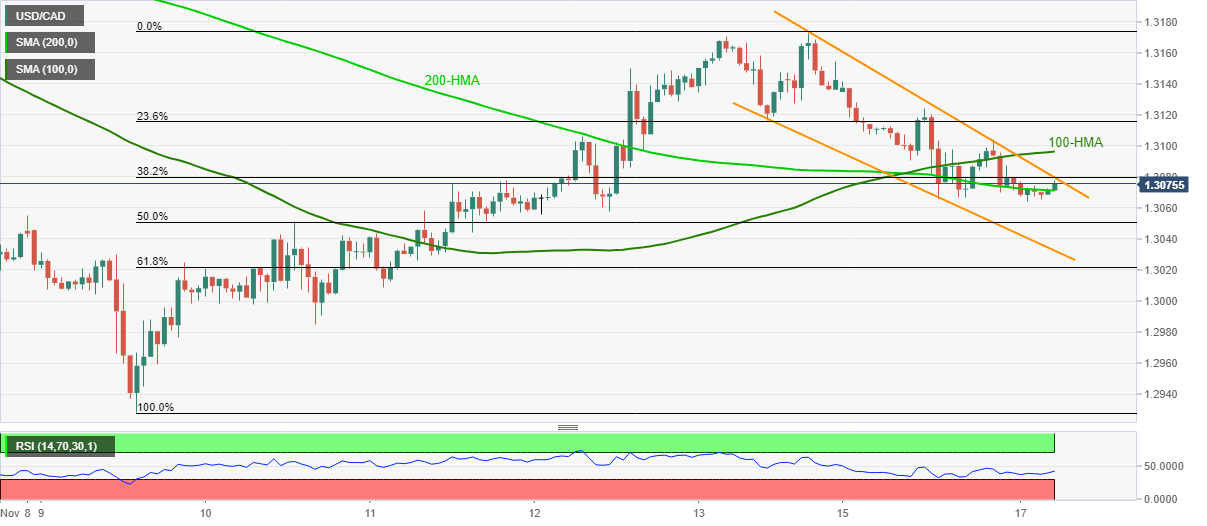
USD/CAD picks up bids near 1.3077 during the pre-European session open trading on Tuesday. In doing so, the pair nurses the intraday losses, currently around 0.15%, while probing a two-day-old falling channel, part of the bullish flag chart play on the hourly (1H) formation.
Considering the RSI line that gradually recovers from nearly oversold conditions, the USD/CAD corrective pullback is likely to confirm the bullish flag with an upside break of 1.3080. However, 100-HMA near 1.3100 becomes an additional burden for the pair’s to clear.
Should there be a sustained rise past-1.3100, Friday’s peak near 1.3172 will become the USD/CAD bulls’ favorite.
On the contrary, 50% Fibonacci retracement of November 09-13 upside, close to 1.3050, becomes the nearby support to watch during the fresh pullback.
Though, any further downside past-1.3050 will be capped by the stated pattern’s support line, at 1.3032 now.
If at all the bears dominate past-1.3032, the 61.8% Fibonacci retracement level of 1.3020 and the 1.3000 round-figure become the key to watch.
USD/CAD hourly chart
Trend: Further recovery expected
