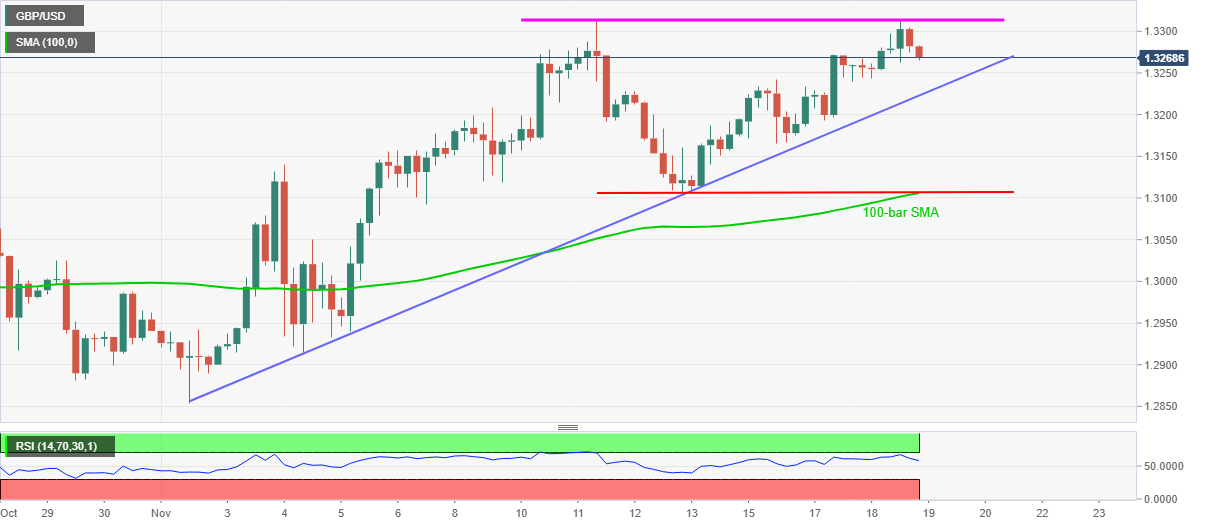
- GBP/USD pulls back from November 11 high, eyes two-week-old support line.
- RSI weakness from nearly overbought territory, tough resistance suggest further declines.
- Bulls can aim for September high beyond 1.3315, 1.3105/3100 becomes the key support.
Having slipped from 1.3312, GBP/USD wavers around 1.3270 during the initial Asian session on Thursday. In doing so, the cable highlights a short-term ascending triangle formation on the four-hour (4H) chart.
Considering the latest pullback in RSI from almost overbought conditions, coupled with the failures to cross 1.3315/10 area, GBP/USD sellers can attempt confirming the bearish chart pattern. As a result, a break below the upward sloping trend line from November 02, near 1.3220 now, becomes the key.
It should, however, be noted that the pair’s declines past-1.3220 will be probed by a confluence of 100-bar SMA and the mid-November lows near 1.3105/3100 area.
If the bears dominate past-1.3100, the downside pressure will get additional fuel from the “double-top” confirmation, which in turn directs the quote towards the sub-1.3000 area.
Meanwhile, an upside clearance of the 1.3315 resistance can push the GBP/USD bulls towards the September high around 1.3485. Though, the 1.3400 round-figure may offer an intermediate halt during the rise.
GBP/USD four-hour chart
Trend: Pullback expected
