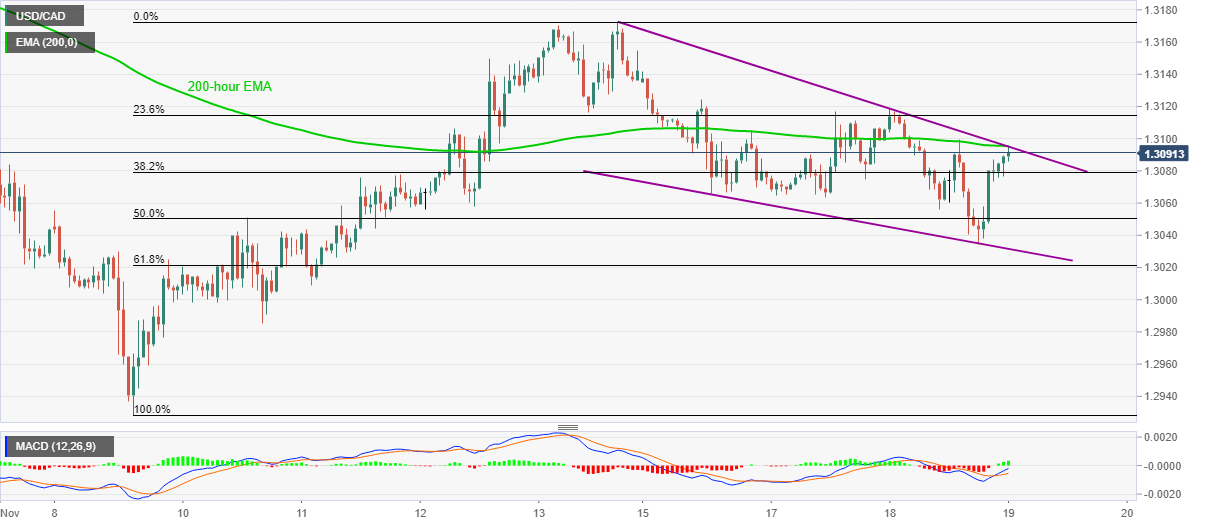
- USD/CAD extends pullback from one-week low inside short-term falling wedge.
- Weekly resistance line, 200-hour EMA offers an immediate challenge to the bulls.
- Sellers can have multiple rest-points before the monthly low.
USD/CAD rises to 1.3095 during the early Thursday’s trading in Asia. In doing so, the pair confronts a joint of 200-hour EMA and a falling trend line from November 13, forming part of a short-term falling wedge.
Although bullish MACD favors the pair’s strength, the key resistance confluence, followed by the 1.3100 threshold, can challenge the USD/CAD buyers.
Should the quote crosses 1.3100 mark, the last Friday’s high of 1.3172 can offer an intermediate halt before propelling the quote towards the monthly peak surrounding 1.3370. Meanwhile, the mid-October top around 1.3260 can act as an intermediate halt.
Alternatively, 50% Fibonacci retracement of November 09-13 upside, near 1.3050 may act as immediate support to watch for the USD/CAD sellers ahead of the bullish pattern’s lower line, currently around 1.3030.
In a case where the bears dominate past-1.3030, the 61.8% Fibonacci retracement level near 1.3020 and the 1.3000 psychological magnet can probe further downside before highlighting the monthly bottom close to 1.2930.
USD/CAD hourly chart
Trend: Pullback expected
