A December to remember for gold? The precious metal has kicked off the last month of the year with a bang – jumping back above $1,800 and reversing its losses in late November. The market has returned to an upbeat mood and XAU/USD is rising with stocks once again.
What are the next levels to watch?
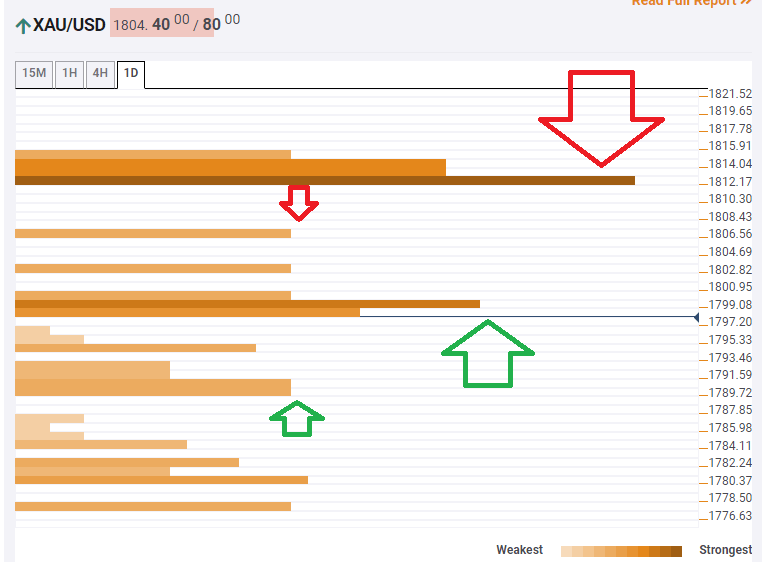
The Technical Confluences Indicator is showing that some weak resistance awaits at $1,806, where the Fibonacci 161.8% one-day awaits the price.
A critical cap is at $1,812, which is a dense cluster of levels including the Pivot Point one-day Resistance 3, the Fibonacci 38.2% one-week, and the Fibonacci 23.6% one-month.
Support is found at $1,799, which is the convergence of the Bollinger Band 15min-Upper, the Fibonacci 23.6% one-week, and the all-important 200-day Simple Moving Average.
Another noteworthy cushion awaits at around $1,790, which is the confluence of the previous daily high and the PP one-day R1.
Key XAU/USD resistances and supports
Confluence Detector
The Confluence Detector finds exciting opportunities using Technical Confluences. The TC is a tool to locate and point out those price levels where there is a congestion of indicators, moving averages, Fibonacci levels, Pivot Points, etc. Knowing where these congestion points are located is very useful for the trader, and can be used as a basis for different strategies.
Learn more about Technical Confluence
