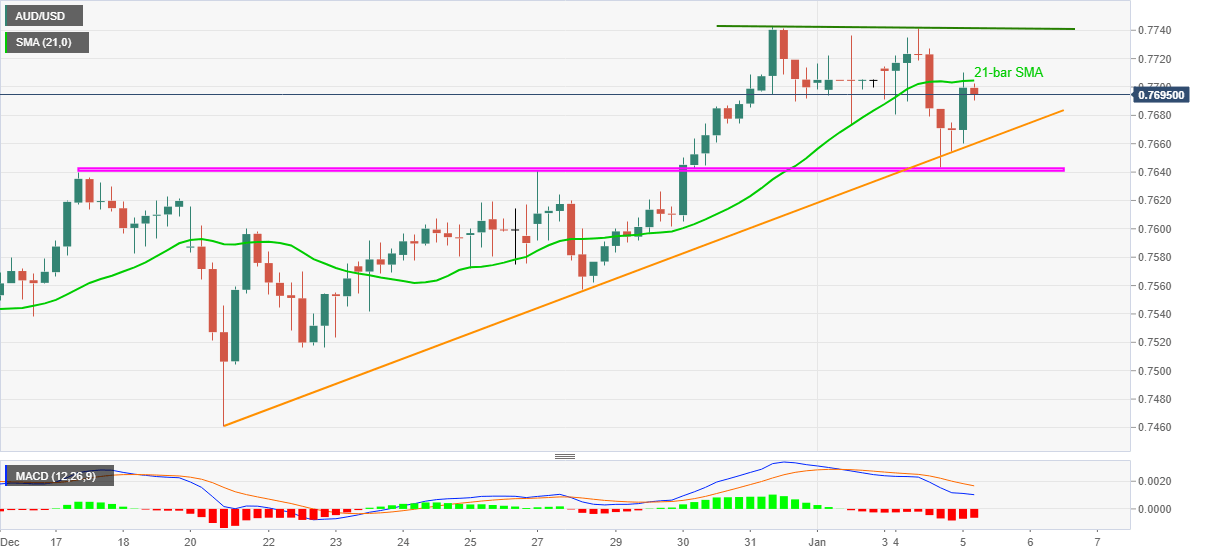
- AUD/USD trims early-Asian gains, steps back from 21-bar SMA.
- Bearish MACD, double top around 0.7740/45 favor sellers.
- Two-week-old rising trend line, short-term horizontal area restricts immediate downside.
AUD/USD witnesses a pullback from 0.7710, currently up 0.37% intraday around 0.7693, during early Tuesday. The aussie pair dropped from the multi-month high the previous day but an ascending trend line from December 21 and a 13-day-long horizontal area restricts the quote’s downside.
The 21-bar SMA takes clues from bearish MACD signals to trigger the latest weakness in AUD/USD prices, which in turn suggest further consolidation of gains towards testing the stated support line, at 0.7660.
Also acting as the key support will be the region including multiple levels since December 17, around 0.7640/45.
Although buyers are likely to return from 0.7640, failures to do so can help AUD/USD bears to challenge the 0.7600 threshold.
Meanwhile, an upside break of 21-bar SMA, at 0.7704 now, will eye for the recent highs marked around 0.7740/45, also the highest since April 2018. In a case where the bulls manage to cross 0.7745, April 2018 top near 0.7815 will gain the market’s attention.
Overall, AUD/USD remains in an uptrend unless breaking the short-term support line and horizontal area. However, intermediate retracements can’t be ruled out.
AUD/USD four-hour chart
Trend: Pullback expected

