- Gold prices correcting the downside bearish impulse.
- Bears attacking the bulls commitments at critical support.
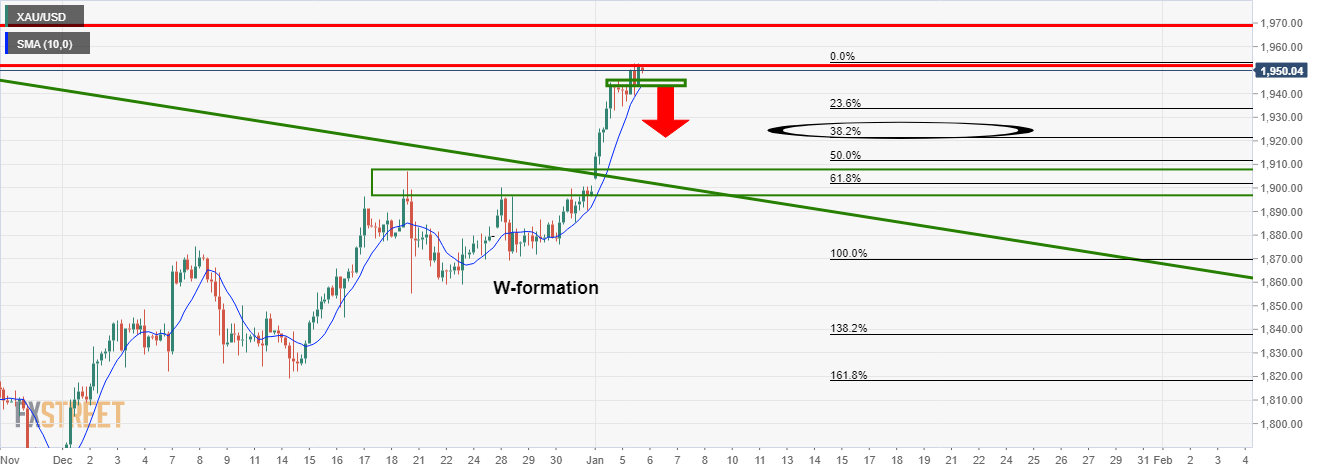
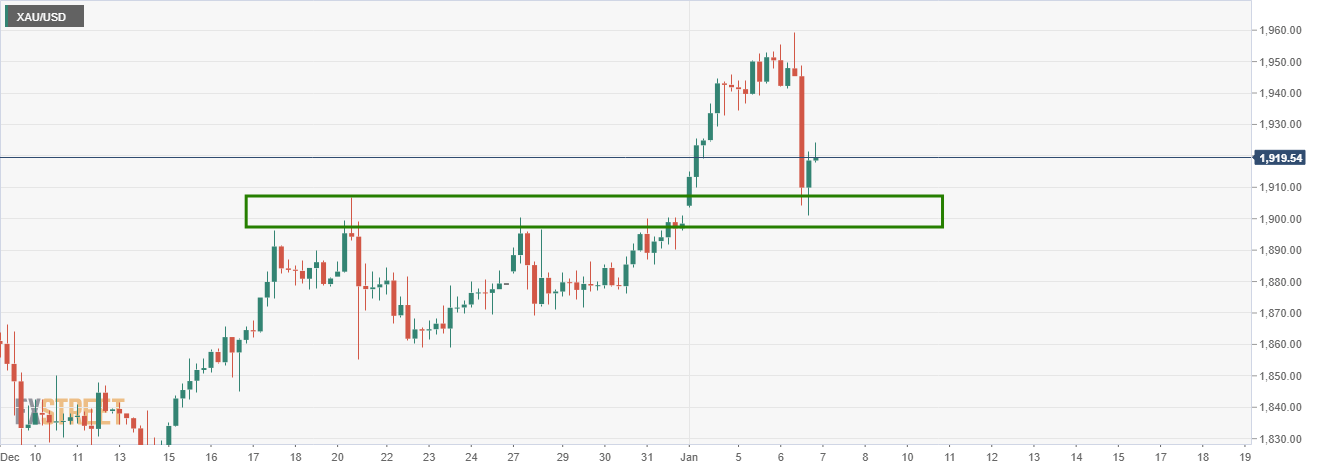
As per the prior analysis, Gold Price Analysis: XAU/USD bears waiting to pounce, the price has indeed deteriorated as forecasted:
4-hour chart prior analysis
Current price
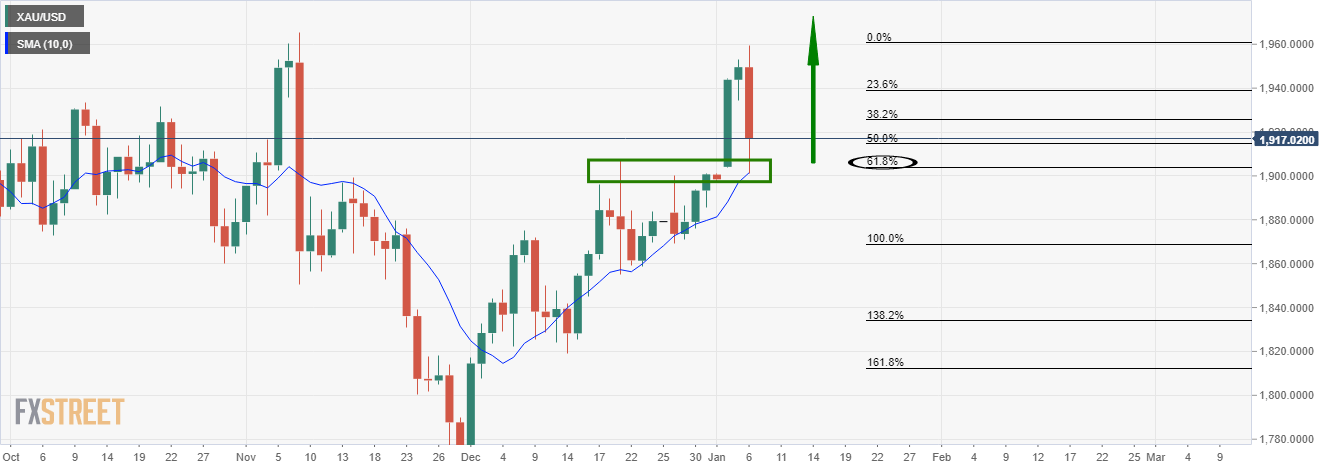
Daily chart
The daily chart shows that the price has been held up at the 10-day moving average and the 61.8% retracement level of the extended W-formation’s bullish impulse.
While there could still be some downside to go, the upside would be expected to resume eventually.
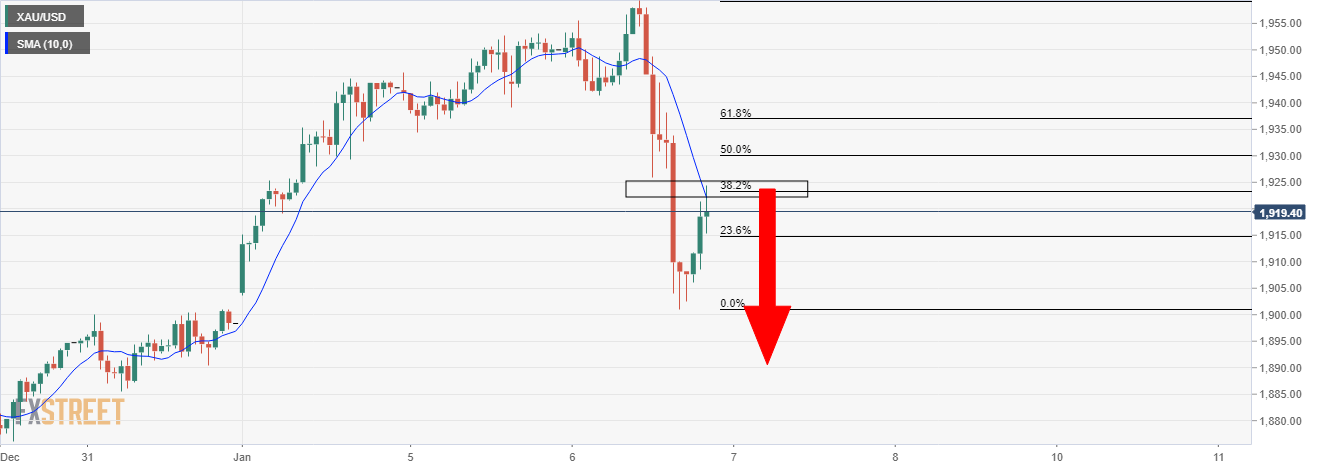
Hourly chart
Following such a shape drop and the slow correction decelerating to a 38.2% Fibonacci retracement, a downside extension could be on the cards.
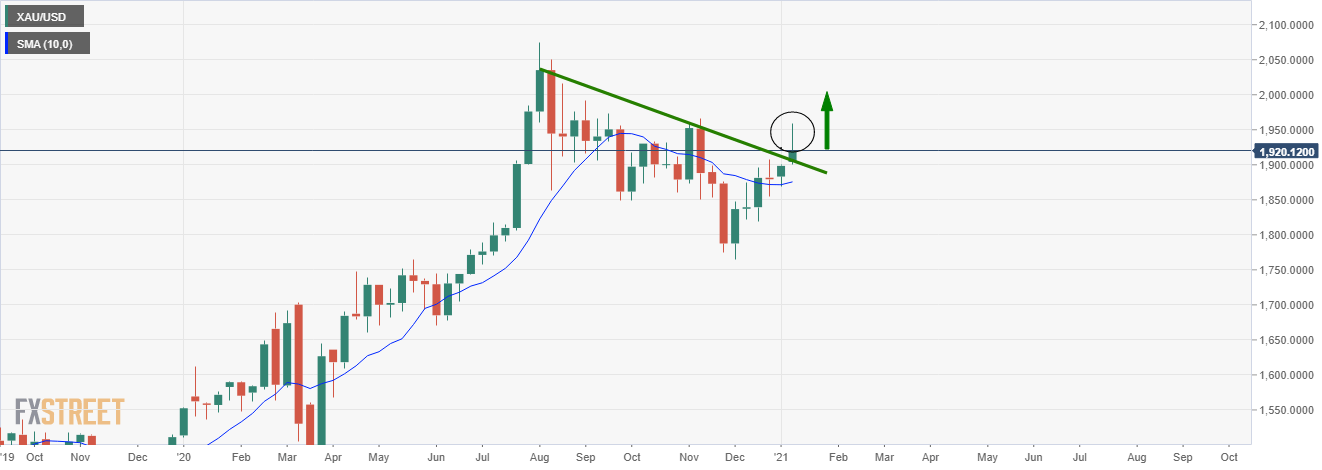
Weekly chart
The wick that has been left as a consequence of the recent price action would be expected to be filled in so long as the week ends bullishly.
