- USD/TRY consolidates recent losses in a choppy range.
- Bearish MACD, failures to keep corrective pullback from the key SMA favor sellers.
- Buyers need to cross the three-month-old resistance line to confirm the upward trajectory.
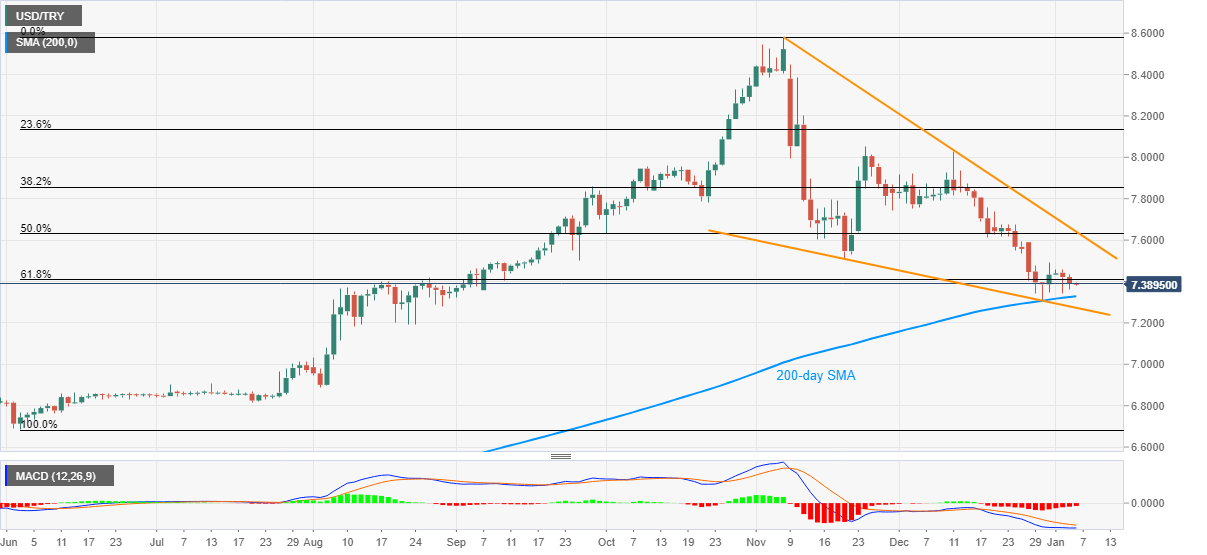
USD/TRY seesaws in a range between 7.3813 and 7.3930, currently around 7.3885, during the pre-European session trading on Wednesday. In doing so, the quote clings to 61.8% Fibonacci retracement of June-November 2020 upside while failing to keep the recovery moves from 200-day SMA portrayed a week back.
Considering the bearish MACD and the pair’s inability to regain the buyers’ confidence, odds of its 200-day SMA re-test, currently around 7.3288, can’t be denied.
However, any further downside past-200-day SMA will be checked by the support line of a two-month-old falling wedge formation, currently around 7.2730.
Should USD/TRY bears dominate below 7.2730 late August 2020 lows near 7.1900 will gain the market’s attention.
On the upside, the recent high of 7.4930 and the 7.5000 round-figure will guard the immediate recovery moves. Also acting as a hurdle is the November low near 7.5060.
In a case where USD/TRY bulls manage to cross 7.5060, 50% Fibonacci retracement and the upper line of the stated bullish chart pattern near 7.6400 will the key to watch as a north-side break of which can probe record tops marked the previous year.
USD/TRY daily chart
Trend: Pullback expected
