- Gold prices fail to keep early Asia’s corrective pullback.
- 10-day SMA, five-week-old ascending trend line lure short-term sellers.
- Bulls need to cross a downward sloping trend line from mid-September for fresh entries.
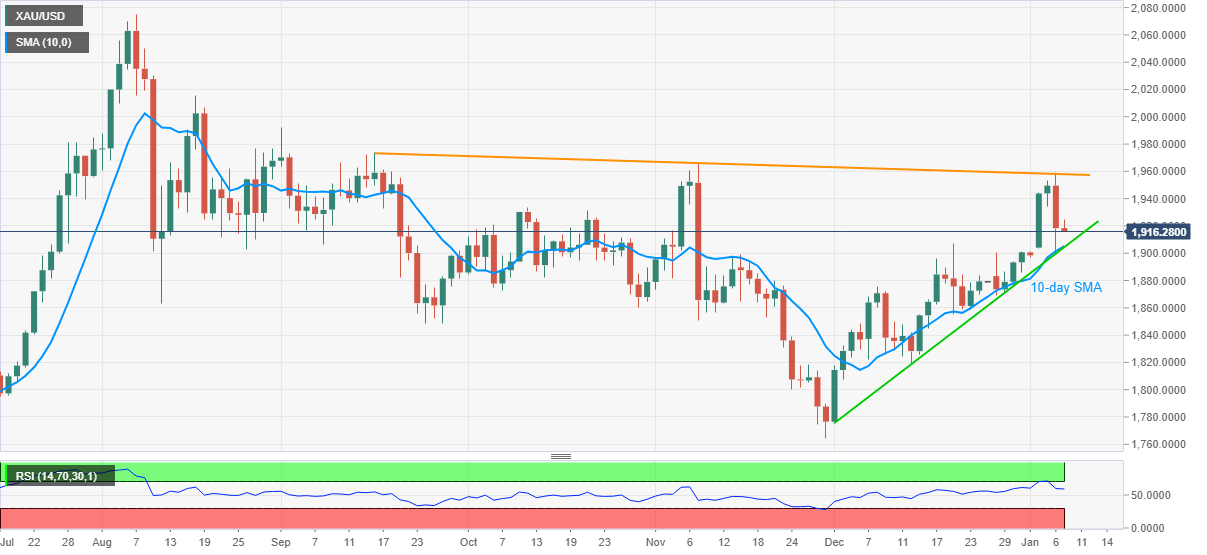
Having flashed biggest losses in over a month, gold fails to consolidate as it drops to $1,917.75, down 0.08% intraday, during early Thursday. The yellow metal took a U-turn from a short-term falling resistance line the previous day and hence the sellers are looking for further favors.
As a result, a confluence of 10-day SMA and an ascending trend line from December 01, 2020, around $1,905, gains the market attention amid normal RSI conditions.
It should, however, be noted that any further downside past-$1,905 will need validation from the $1,900 round-figure to revisit the early-December top surrounding $1,875.
Meanwhile, the $1,950 can test the immediate recovery moves, if any, ahead of the stated resistance line near $1,958. Also acting as an upside barrier is the November top around $1,965.
Overall, gold prices are gradually recovery but the recent pullback from the key resistance, amid normal RSI conditions, favors short-term declines.
Gold daily chart
Trend: Further weakness expected

