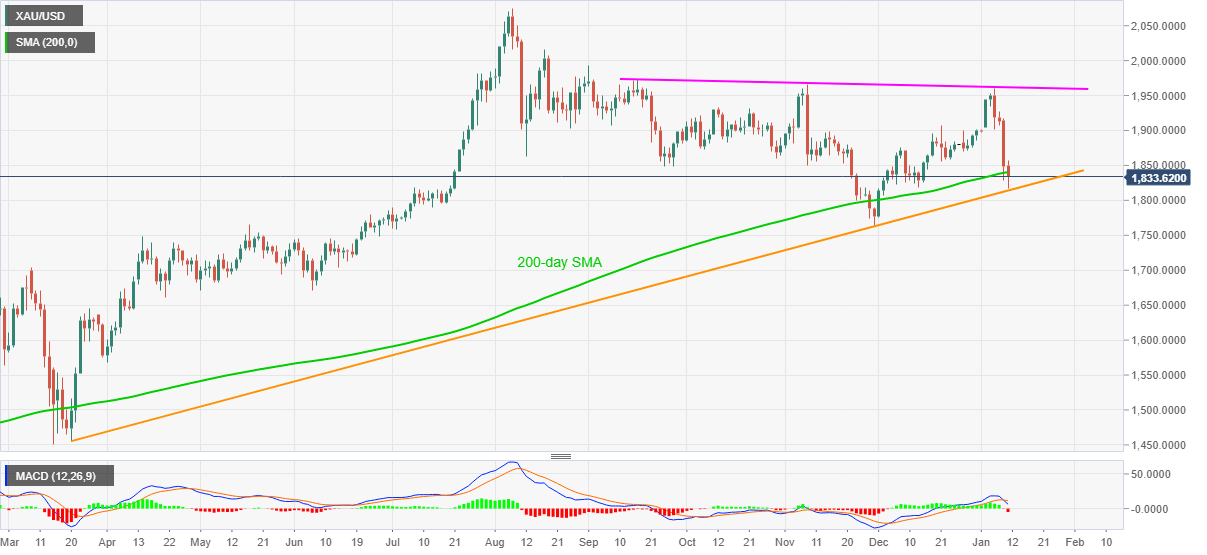
- Gold remains on the back foot despite recent corrective pullback.
- Sustained break of 200-day SMA, most bearish MACD in six weeks favor gold sellers.
Gold licks its wounds near $1,831, down 0.90% intraday, during early Monday. In doing so, the yellow metal steps back from the intraday low, also the lowest since December 02, as an ascending trend line from March 20, 2020, restricts the bullion’s further downside.
Although the key support line questions gold sellers, the commodity’s sustained trading below 200-day SMA and the most MACD signals since early December suggest the quote’s further downside.
As a result, fresh selling can wait for a clear downside break of a medium-term key trend line support, at $1,813 now.
Following that, the $1,800 threshold can offer intermediate support ahead of highlighting November’s low near $1,765 on the gold bears’ radar.
Meanwhile, a corrective pullback above the 200-day SMA level of $1,840 may target to regain the $1,900 threshold but gold buyers need to remain cautious unless breaking a descending trend line from mid-September, currently around $1,962.
Overall, gold is up for a lower grind but hopes of the US stimulus can renew risks and favor the bounce off the important support line.
Read: S&P 500 Futures snap four-day winning streak amid covid fears, Sino-American tussle
Gold daily chart
Trend: Further weakness expected

