- NZD/USD strays on the back foot for fourth consecutive day.
- Normal RSI conditions challenge bears near key technical supports.
- Bulls remain cautious unless crossing the 0.7300 threshold.
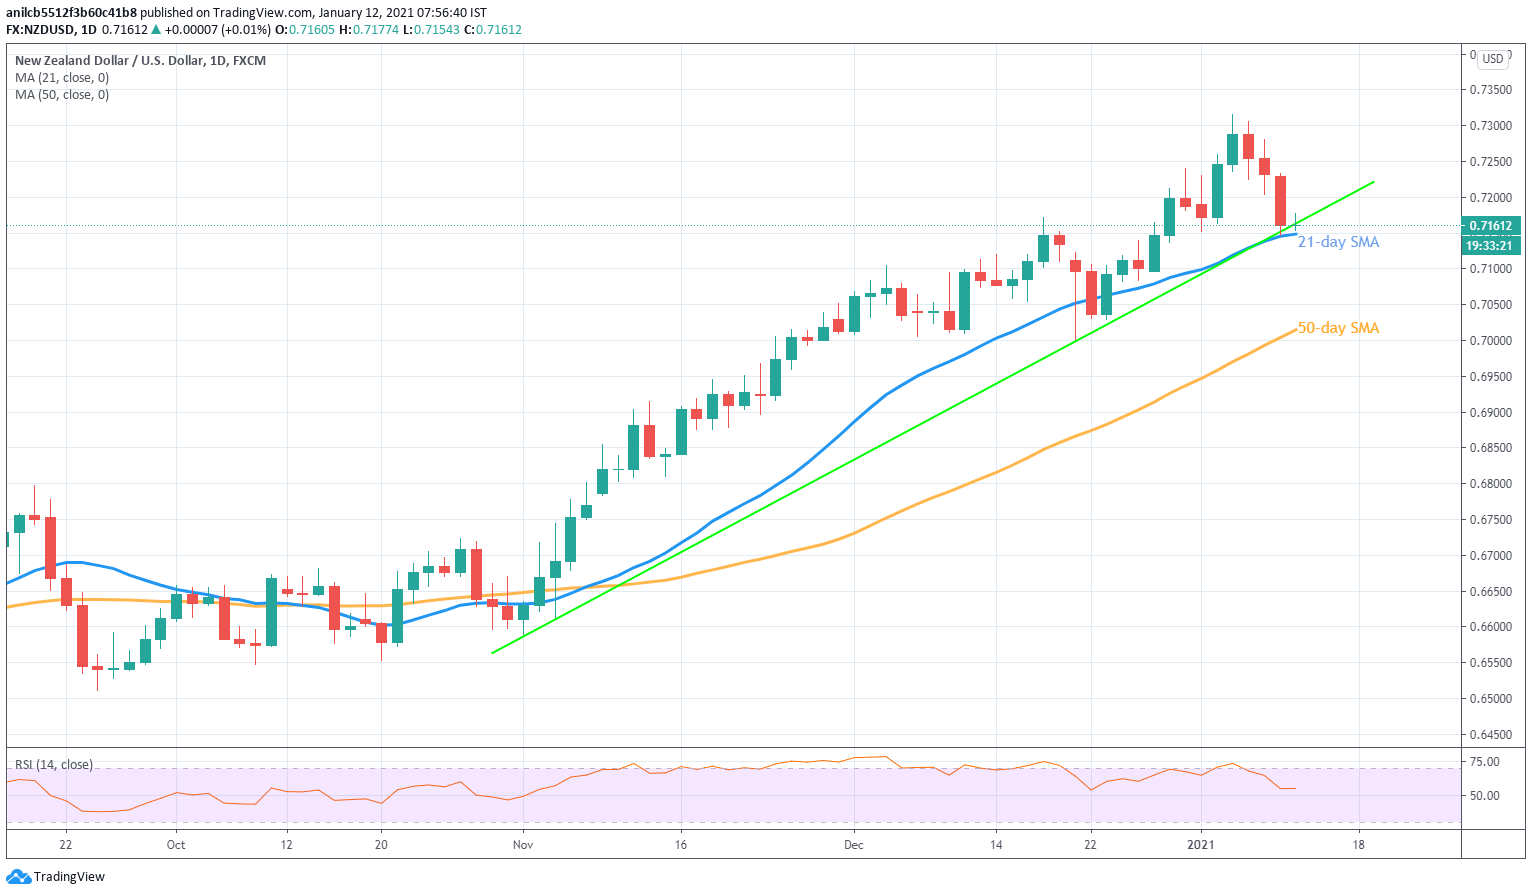
NZD/USD drops to 0.7160, down 0.10% intraday, during early Tuesday. In doing so, the kiwi pair prints a four-day downtrend as bears battle 21-day SMA and an upward sloping trend line from November 02.
As RSI stabilizes around the 50 level, following its pullback from overbought territory, the bears are likely to wait for a clear downside break below 0.7150/45 support confluence.
Following that, a 50-day SMA level of 0.7014 and a December low near 0.7000 will be on the NZD/USD sellers’ radar.
Meanwhile, an area comprising December 31 top and early last week’s lows surrounding 0.7240 will add filters to the pair’s upside past-0.7200.
Even if the NZD/USD buyers manage to cross 0.7240, they can wait for a sustained upside beyond the recent multi-month high around the 0.7300 threshold before eyeing the April 2018 peak surrounding the 0.7400 round-figure.
NZD/USD daily chart
Trend: Pullback expected
