- Gold is expected to reach at least a 38.2% Fibonacci of the sharp bearish impulse.
- US yields playing a role in the US dollar’s rebound.
The price of gold has started to stabilise and retrace a very sharp bearish impulse from the $1910/20 area.
It has been a US dollar story for the most part which has driven the value of the precious metal lower, in a move sparked off by rising US yields.
”Positioning data immediately following last week’s surprise Blue Sweep highlights just how little dry-powder gold bugs had remaining,” analysts at TD Securities explained.
”CTAs are set to liquidate their gold length and target a net short position, which should weigh on the metal in the near-term,” the analysis added.
”This doesn’t bode well for gold flows, particularly given that gold is an inflation-hedge asset only inasmuch as the Fed’s stance on rates translates into a low rates vol environment.”
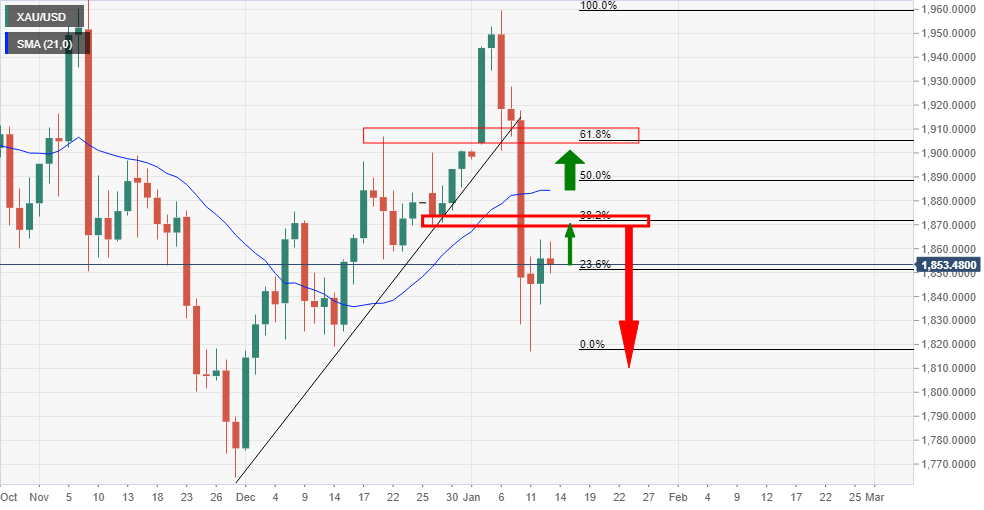
Meanwhile, from a technical perspective, gold is headed back towards a 38.2% Fibonacci retracement of the bearish impulse.
$1,872 comes in as the 38.2% Fibonacci retracement level.
Gold daily chart
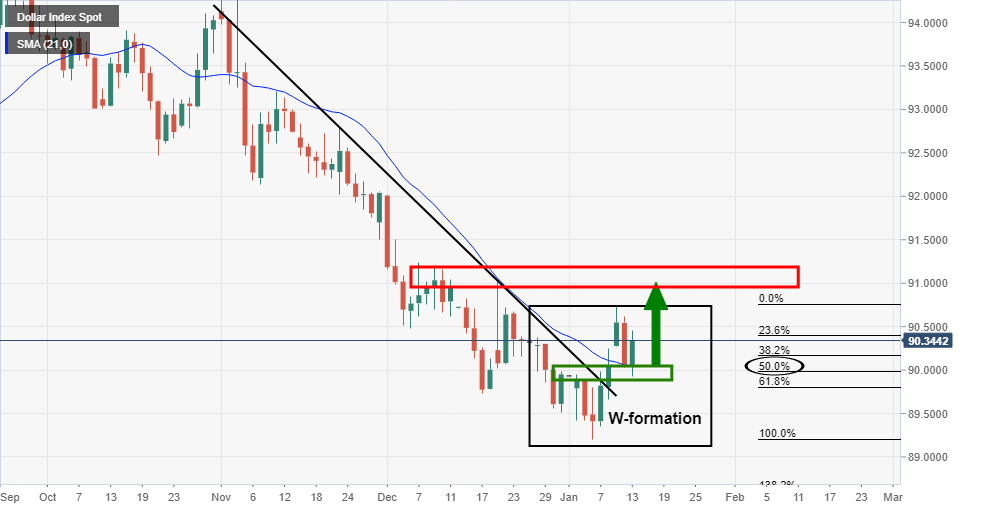
DXY analysis
Meanwhile, the US dollar has just completed a W-formation.
The price has met a 50% mean reversion of the bullish impulse and would now be expected to extend the bullish correction from a confluence of the 21-day moving average, old resistance and the neckline of the W-formation.