Gold has retreated from the highs as President Joe Biden’s stimulus plan is running into opposition from Republicans. Will the new administration settle for quick wins and a smaller package or wait and try to pass a big bill? The precious metal would need more funds – and that they come sooner – in order to gain more ground.
How is XAU/USD positioned on the technical graphs?
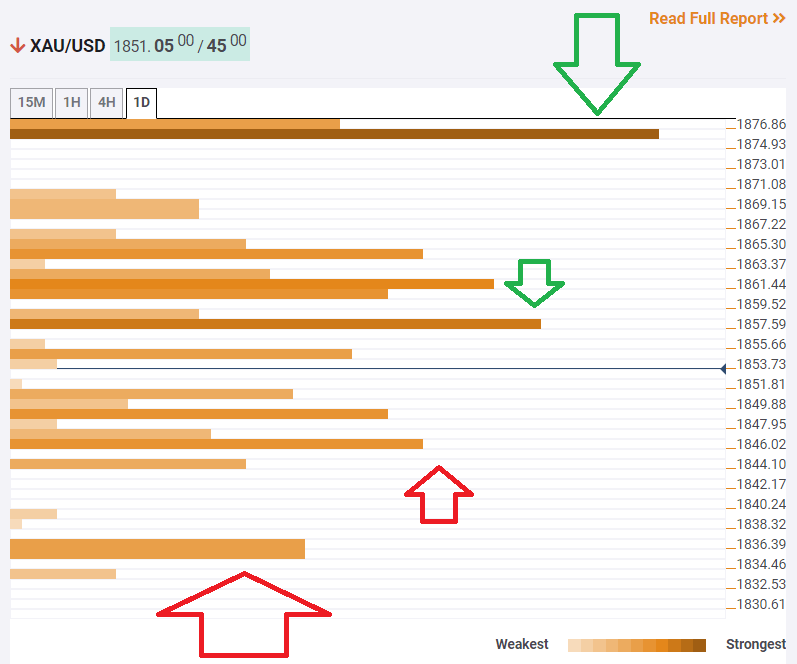
The Technical Confluences Indicator is showing that gold has significant resistance at $1,857, which is the convergence of the Fibonacci 38.2% one-month and the Bollinger Band 4h-Middle.
The upside target for XAU/USD is $1,875, where a dense cluster of levels awaits it. These include the previous daily high, the Simple Moving Average 100-4h, and the Fibonacci 23.6% one-month.
Looking down, $1,847, a considerable cushion awaits at $1,846, which is the meeting point of the SMA 10-15m, the previous 4h-low, and the Fibonacci 61.8% one-week.
Gold bears may eye $1,836, which is the confluence of the Fibonacci 38.2% one-week and the Bollinger Band 4h-Lower. and more.
XAU/USD resistance and support levels
Confluence Detector
The Confluence Detector finds exciting opportunities using Technical Confluences. The TC is a tool to locate and point out those price levels where there is a congestion of indicators, moving averages, Fibonacci levels, Pivot Points, etc. Knowing where these congestion points are located is very useful for the trader, and can be used as a basis for different strategies.
Learn more about Technical Confluence
