- USD/JPY hits highest level since Jan. 11, capitalizing on bullish price pattern.
- The channel breakout is backed by an above-50 RSI.
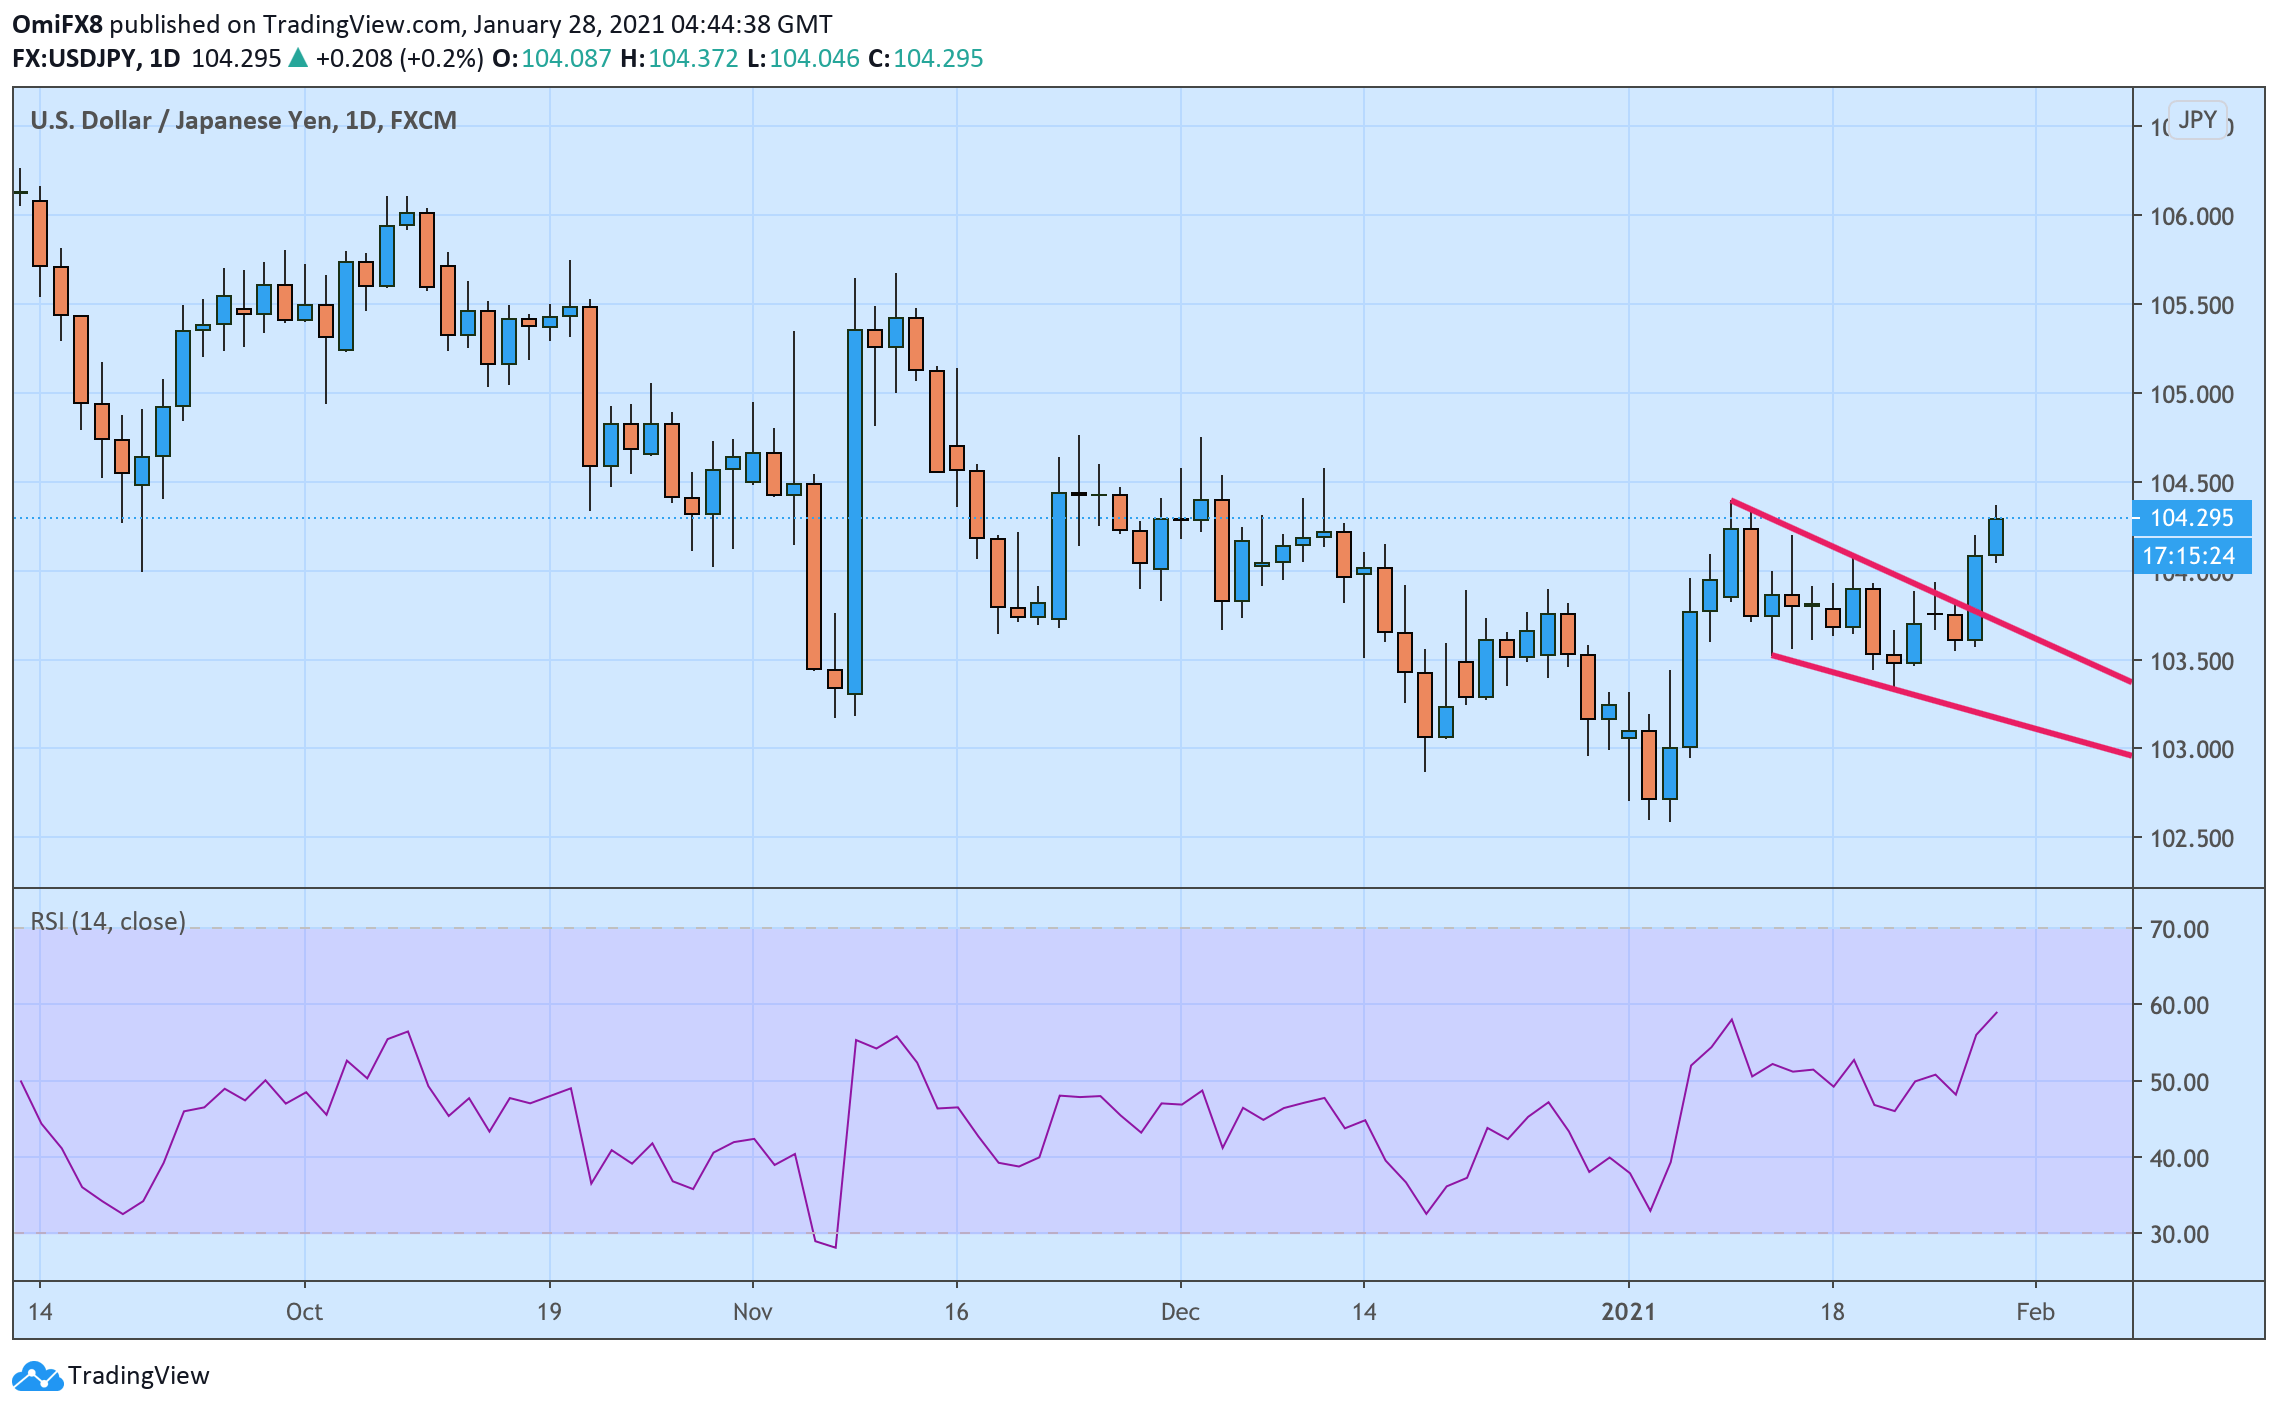
USD/JPY jumped to 104.37 early Thursday – the highest level since Jan. 11 – extending Wednesday’s 0.46% rise to 104.09, which confirmed an upside break of a falling channel represented by trendlines connecting Jan. 11 and Jan. 19 highs and Jan. 13 and Jan. 21 lows.
Wednesday’s breakout and the positive follow-through seen today indicates the recovery rally from the Jan. 6 low of 102.59 has resumed. Coupled with an above-50 or bullish reading on the 14-day Relative Strength Index (RSI), that indicates scope for a rally to 104.75-105.00.
On the downside, 103.58 (Wednesday’s low) is the level to defend for the bulls.
Daily chart
Trend: Bullish
Technical levels
