- USD/JPY consolidates near 104.70 after Friday’s rejection at 105.00.
- Charts remains biased bullish, with key indicator signaling a strongest bull bias since June.
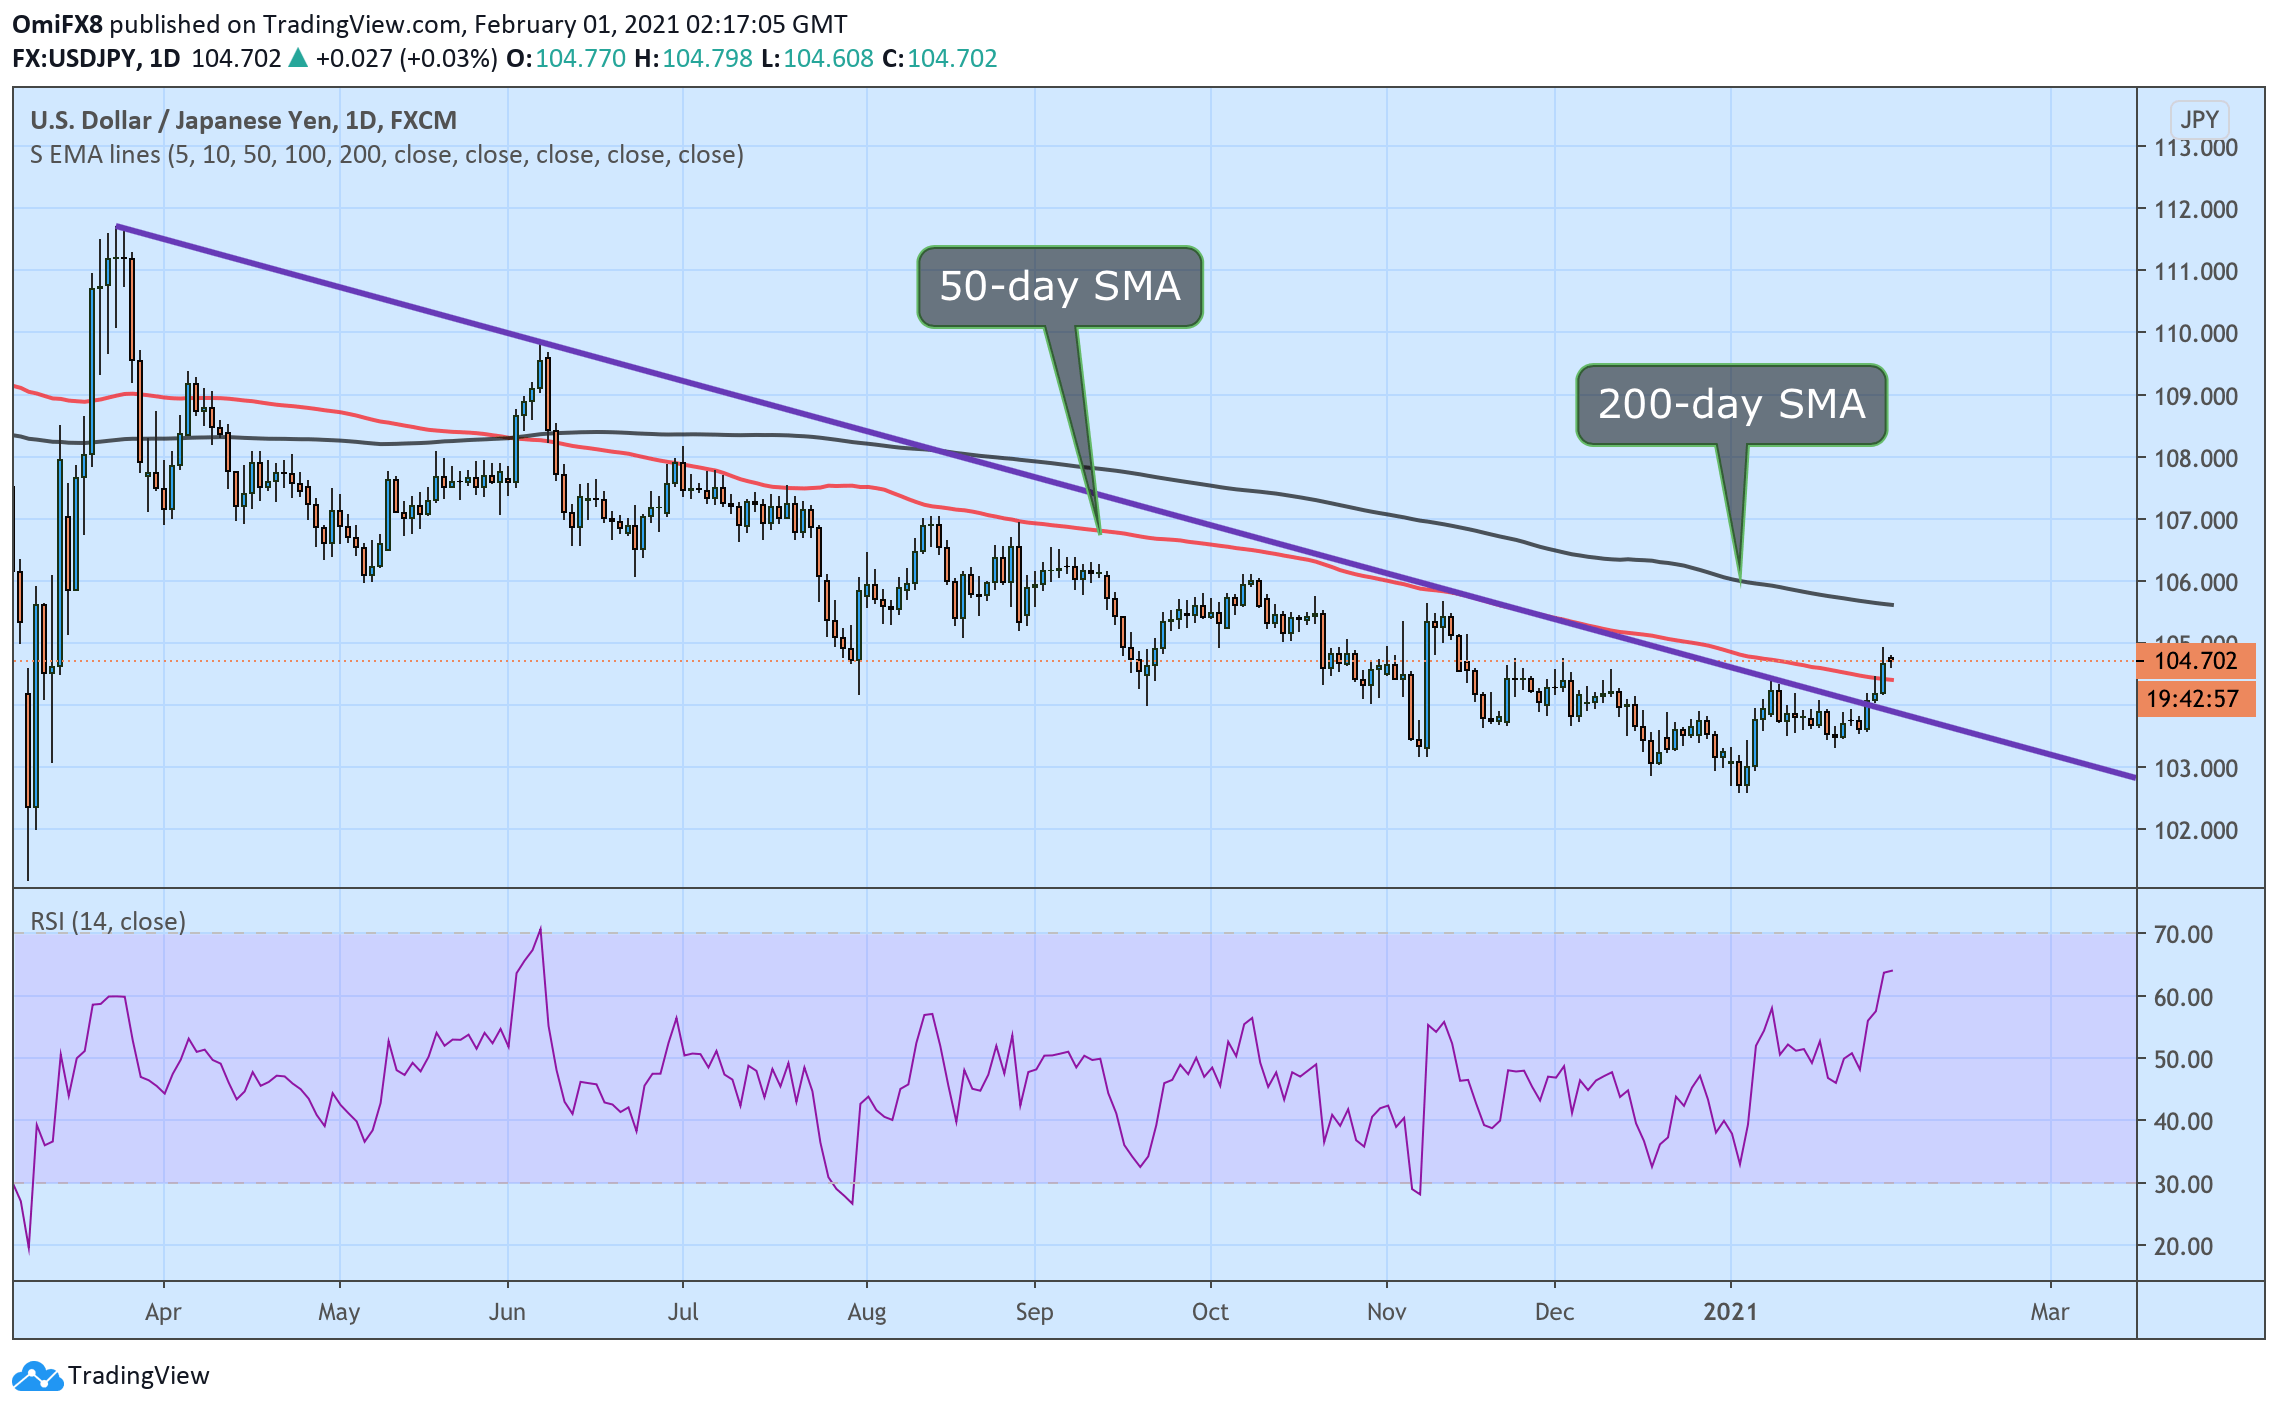
USD/JPY is trading mostly unchanged on the day near 104.70 at press time, having risen for the third straight day on Friday.
The daily chart is biased bullish, with the Relative Strength Index hovering at 64 – the highest level since June. An above-50 reading indicates bullish bias.
Further, the upside break of the trendline falling from March 2020 highs confirmed on Thursday is also valid. The pair has also found acceptance above the widely-tracked 100-day Simple Moving Average.
Therefore, the odds appear stacked in favor of a continued rally. Significant resistance is located at 105.63 (200-day SMA). On the downside, the higher low of 103.33 created on Jan. 21 is the level to beat for the bears.
Daily chart
Trend: Bullish
Technical levels
