NZD/USD is now trading near 0.7213, having hit a high of 0.7225 early Thursday.
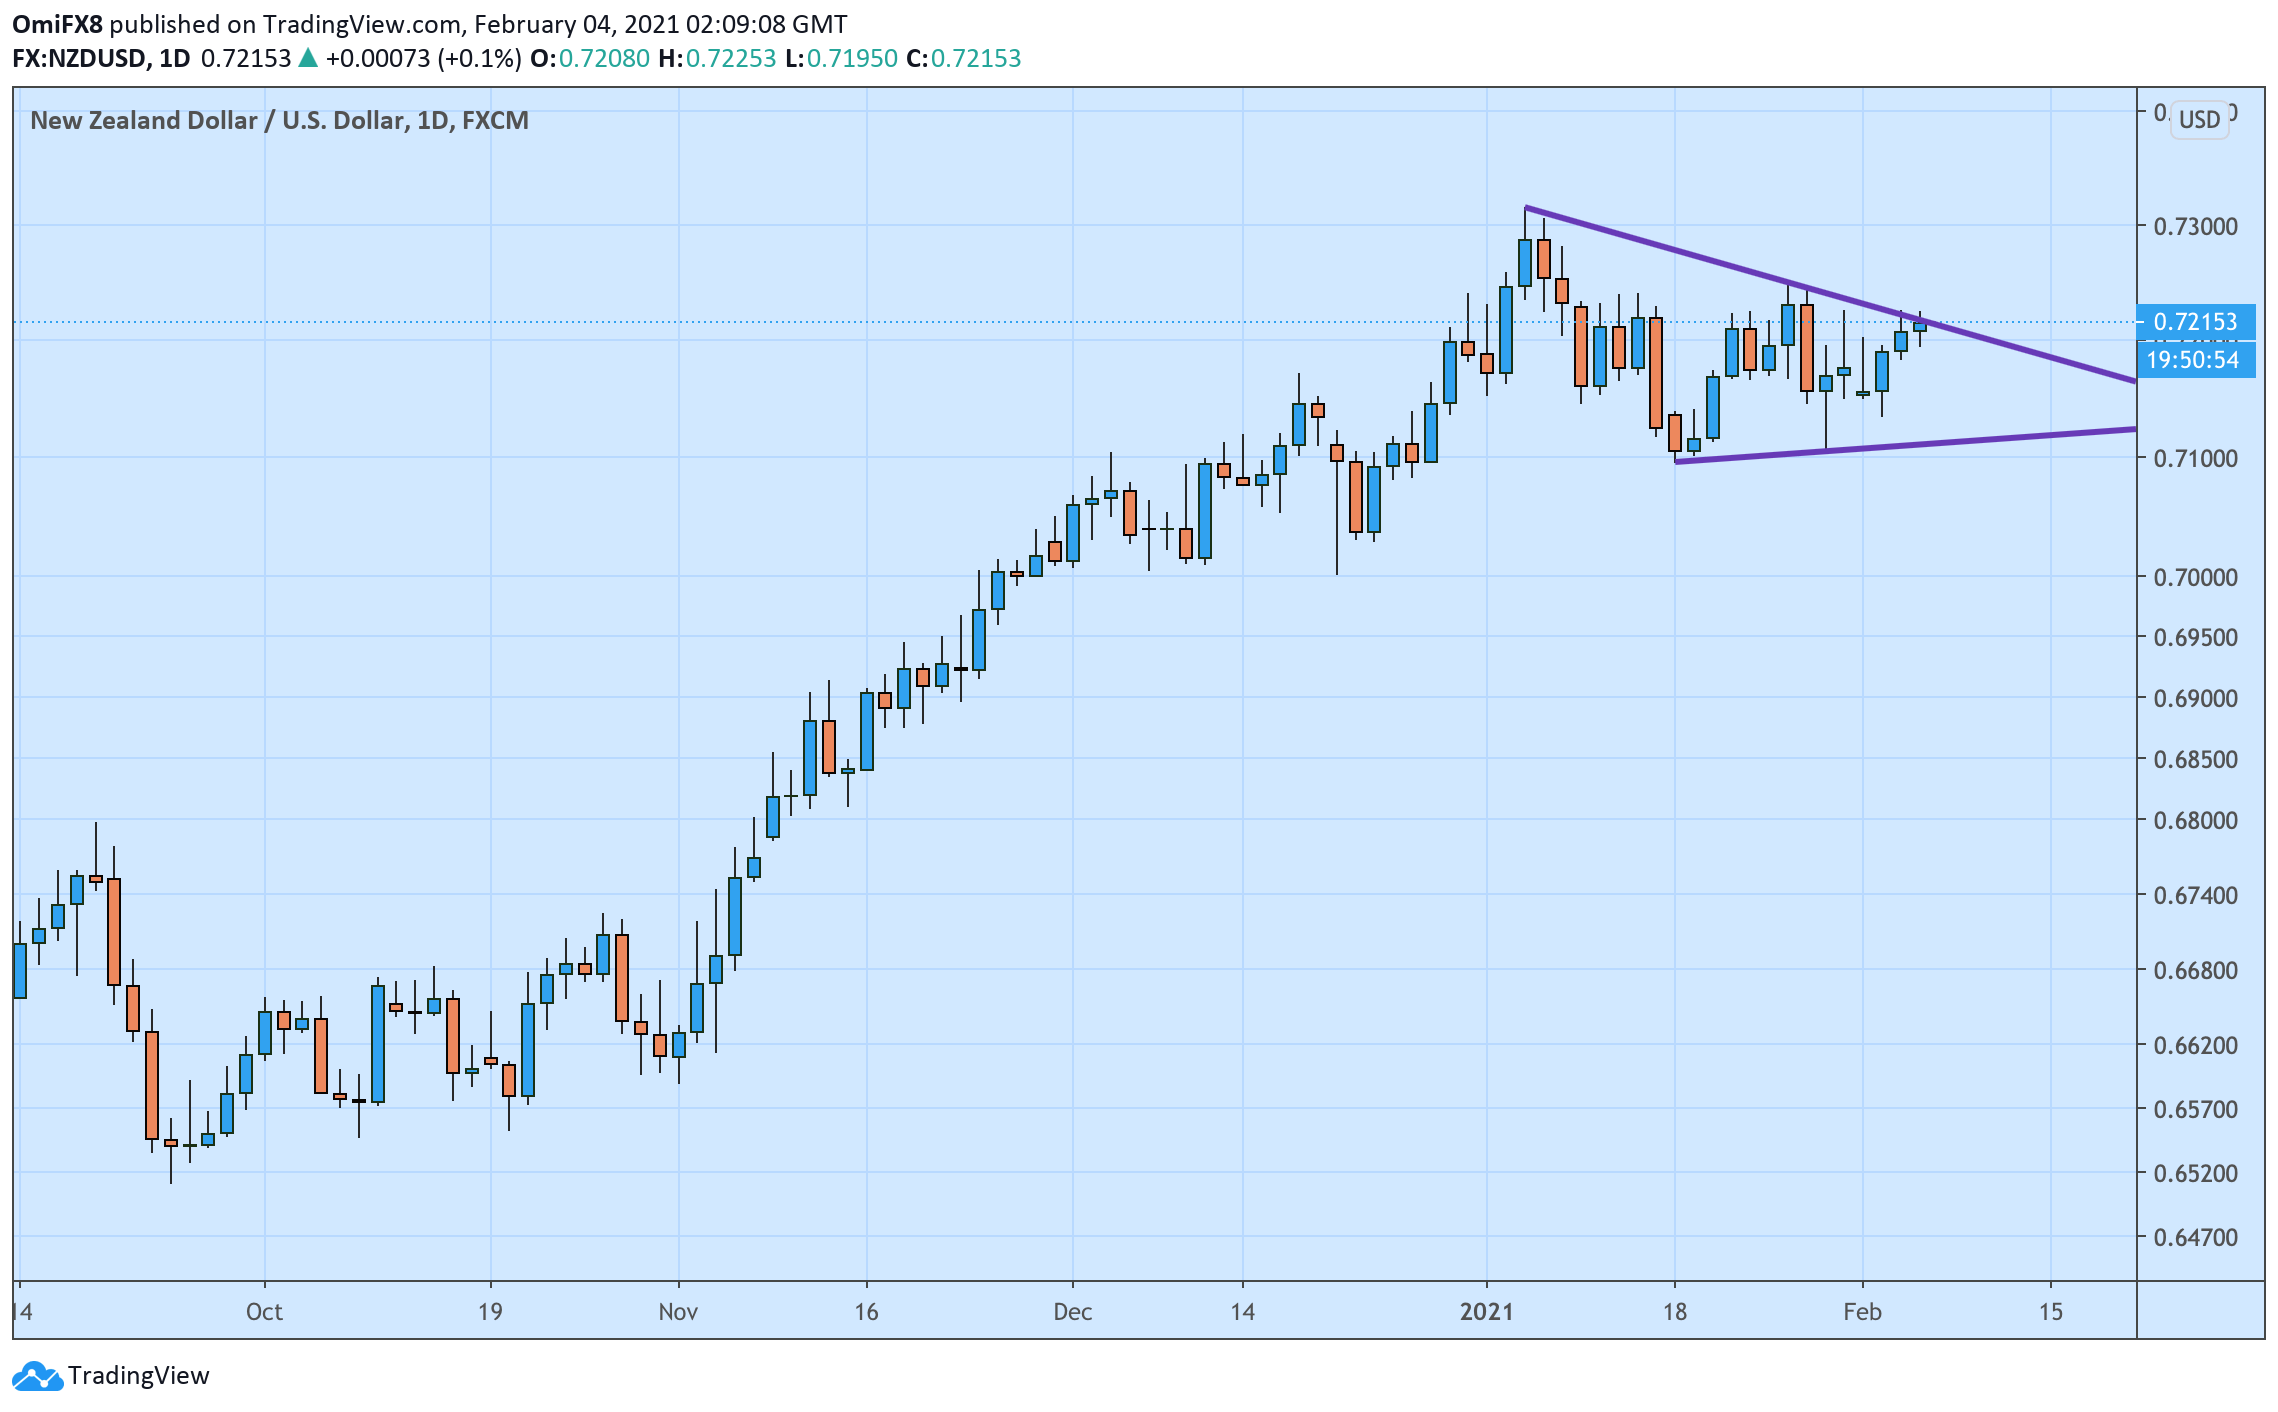
The daily chart shows the bulls are struggling to power a convincing breakout from a triangle pattern represented by trendlines connecting Jan. 6 and Jan. 26 highs and Jan. 18 and Jan. 28 lows.
A daily close above the triangle hurdle, currently at 0.7217, would confirm the breakout and open the doors for a re-test of 0.7315 (Jan. 6 high).
That looks likely, as New Zealand’s strong labor market pointing to a V-shaped economic recovery has reduced the likelihood of additional monetary easing by the Reserve Bank of New Zealand.
That said, the Kiwi remains vulnerable to potential risk aversion. A move below 0.71 would confirm a triangle breakdown or bearish reversal pattern.
Daily chart
Trend: Neutral
Technical levels
