- EUR/USD defends the 100-day SMA support at 1.1957.
- Technical studies suggests scope for a downside break.
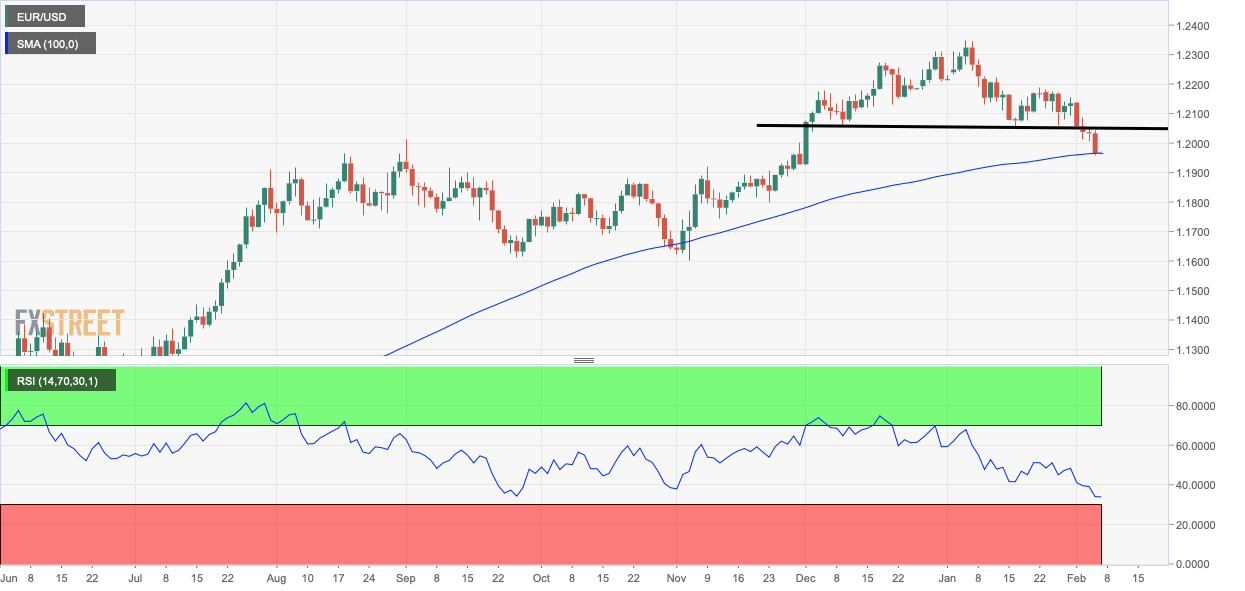
EUR/USD is trading near 1.1968 at press time, having defended the 100-day Simple Moving Average (SMA) support of 1.1957 during the overnight trade.
The pair last tested the 100-day SMA in early November. Back then, the average was located near 1.1660 and recharged engines for a stronger bullish move. The pair found bids near the 100-day SMA and went on to hit a high of 1.2349 on Jan. 6.
The SMA, however, may not hold ground this time, as the 14-day Relative Strength Index has pierced the low of 38.11 seen in early November when the pair defended the 100-day SMA.
Sellers appear to be in control, as Thursday’s red candle has little or no wicks. The bearish momentum looks strong, with the 5- and 10-day SMAs trending south and the MACD histogram reporting negative values.
A break below the 100-day SMA would expose 1.1888 – 61.8% Fibonacci retracement of the rally from 1.1602 to 1.2349.
Daily chart
Trend: Bearish
Technical levels
