Gold (XAU/USD) extends a three-day winning streak on Tuesday, looking to regain the $1850 level. The road to recovery from two-month troughs picks up pace amid an imminent approval of the US $1.9 trillion stimulus package by Congress. Growing optimism on the stimulus is pushing the US inflation expectations, underpinning the inflation-hedge gold.
However, rising longer-term inflation expectations also drive the Treasury yields higher, posing a risk to the rally in gold. Let’s take a look at how is gold positioned technically.
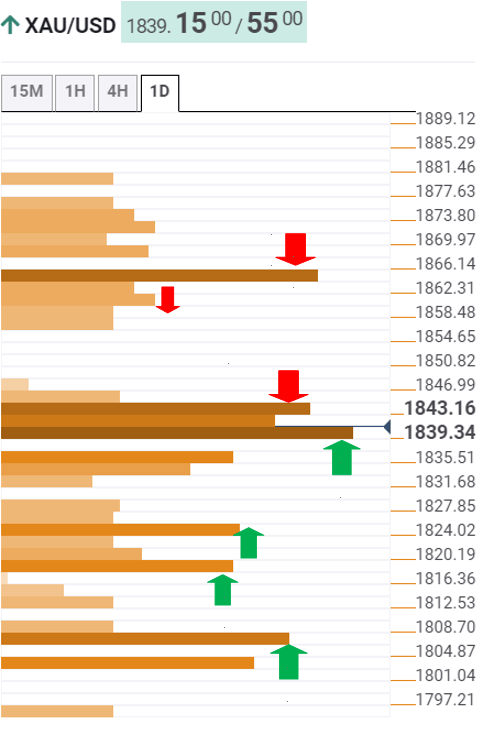
Gold Price Chart: Key resistances and supports
The Technical Confluences Indicator shows that gold is looking to find acceptance above the critical resistance at $1844, which is the confluence of the previous high four-hour, SMA100 four-hour and Fibonacci 23.6% one-month.
The next significant target for the bulls awaits at $1864, where the Fibonacci 38.2% one-month coincides with the SMA200 four-hour.
Ahead of that level, a bunch of minor resistance levels are stacked up around $1860, which is the intersection of the SMA50 one-day and pivot point one-week R1.
Meanwhile, immediate support is seen at $1837, the convergence of the Fibonacci 61.8% one-week, SMA5 one-hour and previous day high.
The next cushion is aligned at $1834, where the SMA200 one-hour and SMA10 one-day intersect.
The SMA10 four-hour support at $1826 could come into play, below which the sellers would aim for $1818, the meeting point of the SMA50 one-hour and Fibonacci 38.2% one-week.
Powerful support at $1808 (previous day low) is the level to beat for the XAU bears.
Here is how it looks on the tool
About Confluence Detector
The TCI (Technical Confluences Indicator) is a tool to locate and point out those price levels where there is a congestion of indicators, moving averages, Fibonacci levels, Pivot Points, etc. Knowing where these congestion points are located is very useful for the trader, and can be used as a basis for different strategies.
