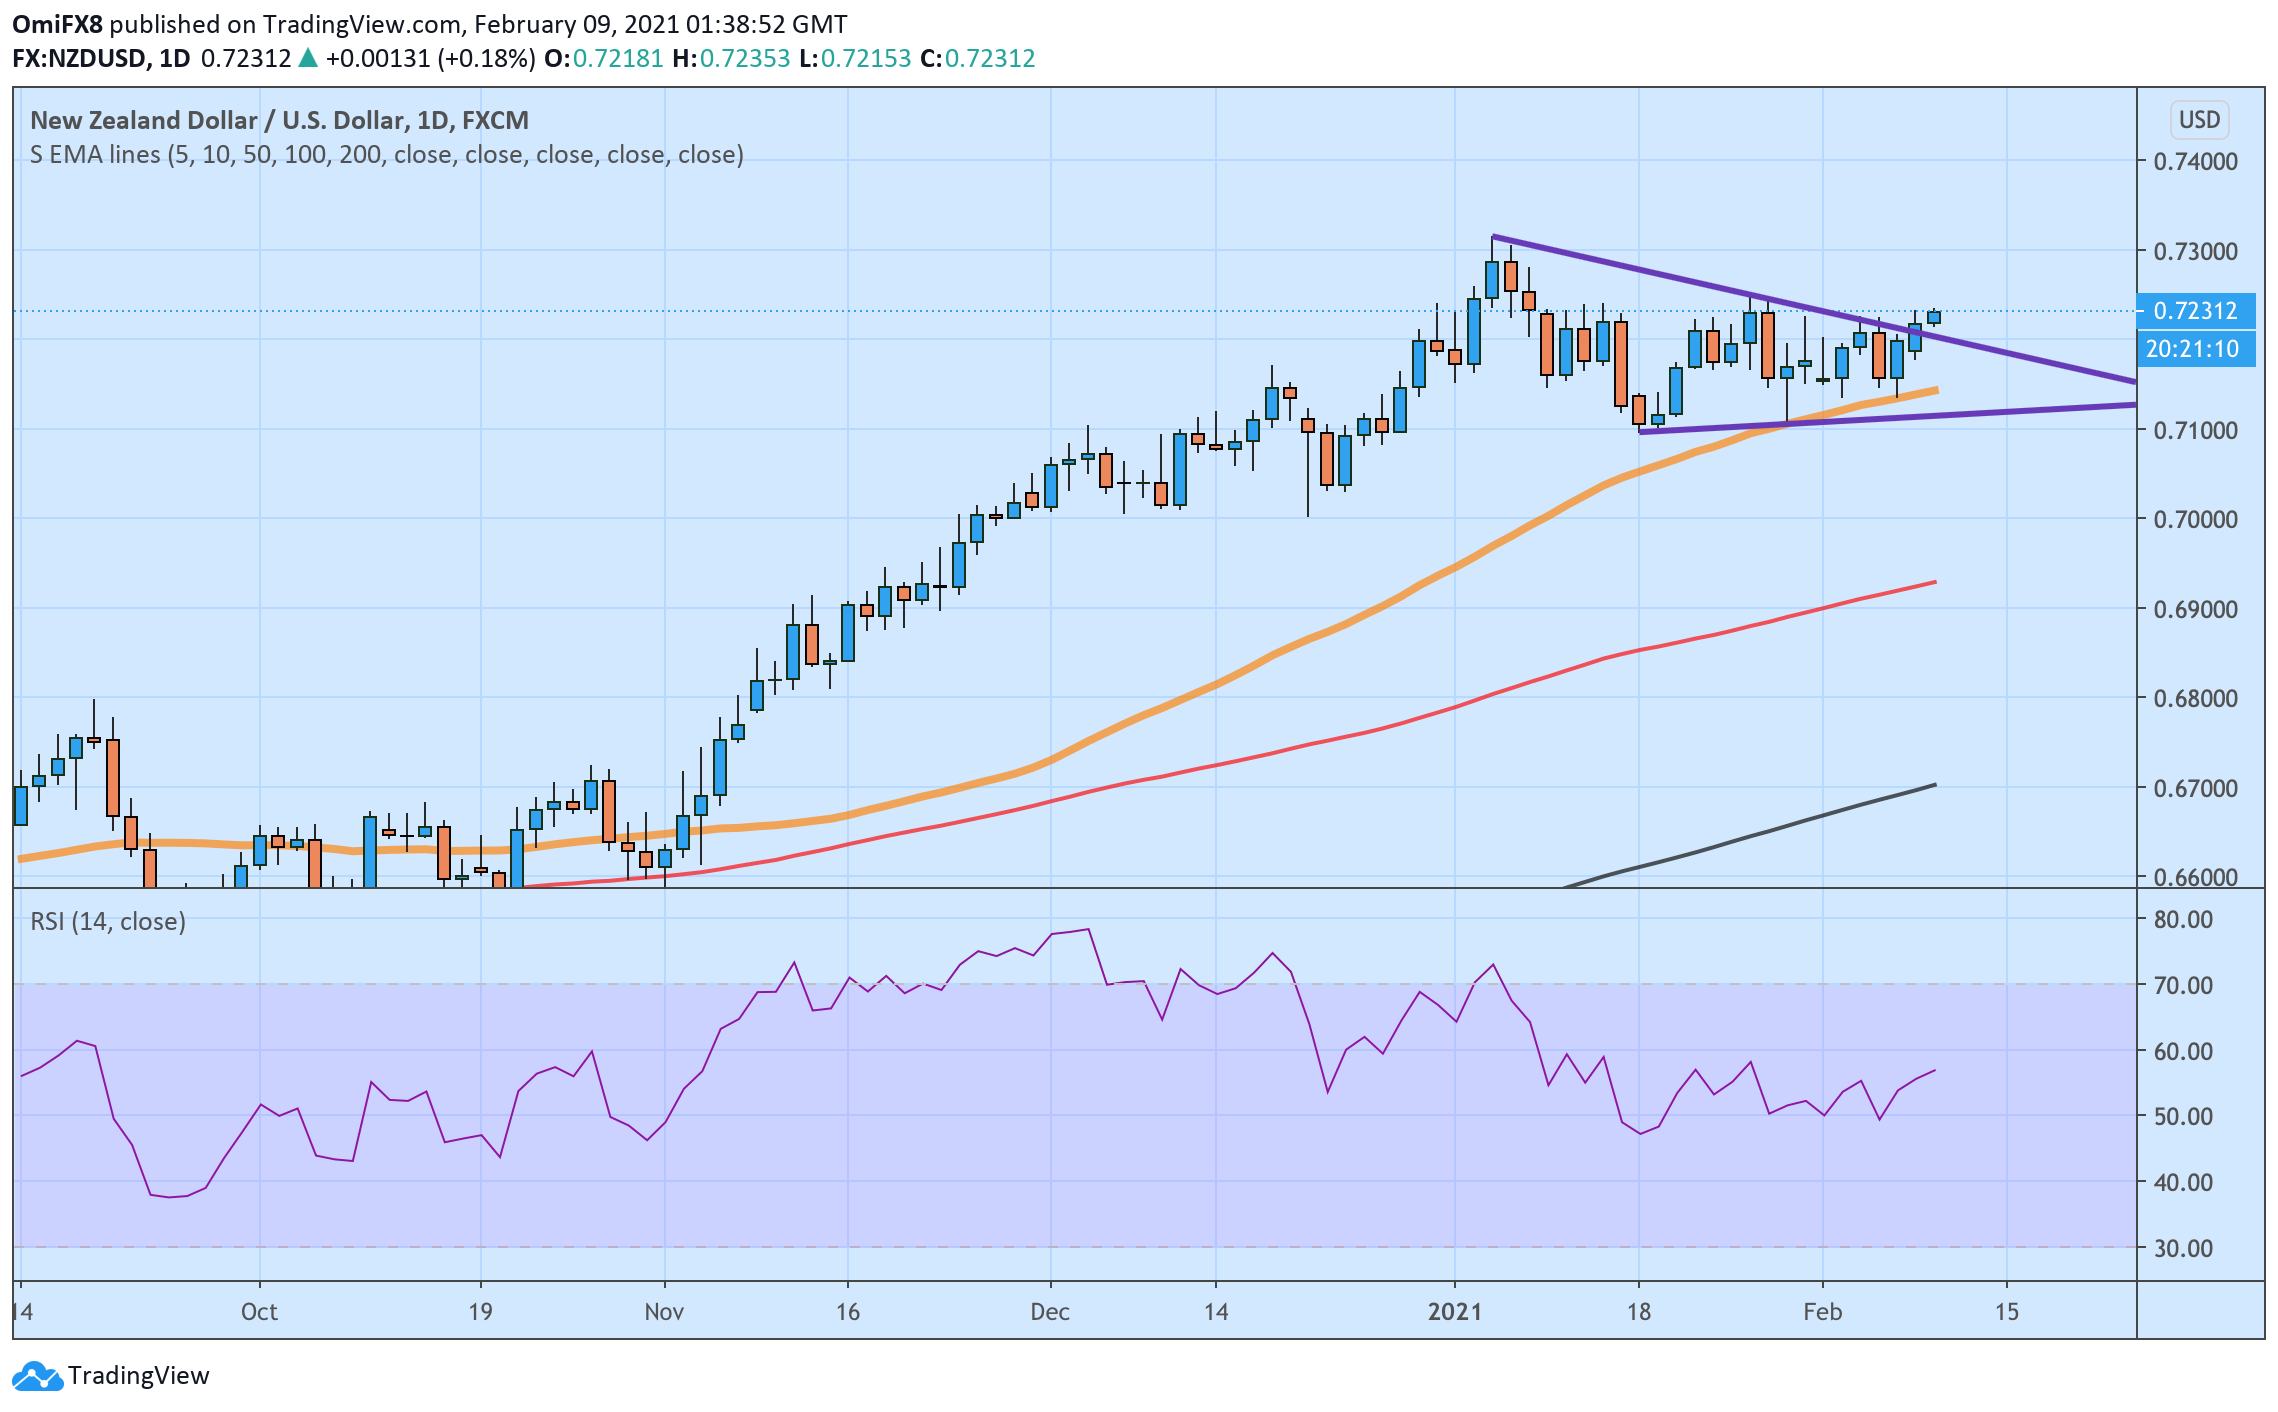
- NZD/USD’s daily chart shows a contracting triangle breakout.
- Momentum indicators are aligned in favor of the bulls.
NZD/USD is currently trading at 0.7232, representing a nearly 0.20% gain.
The daily chart suggests scope for further gains toward the Jan. 6 high of 0.7315.
The pair closed 0.25% higher on Monday, confirming an upside break of the triangle pattern identified by trendlines connecting Jan. 5 and Jan. 26 highs and Jan. 18 and Jan. 28 lows.
The breakout is backed by an above-50 or bullish reading on the 14-day Relative Strength Index and ascending 50-, 100- and 200-day Simple Moving Averages.
A close under the Jan. 18 low of 0.7096 would confirm a reversal lower.
Daily chart
Trend: Bullish
Technical levels
