- Gold staged a modest intraday bounce from 200-hour SMA, albeit lacked follow-through.
- Mixed technical indicators on hourly/daily charts warrant caution for aggressive traders.
Gold found a decent support near 200-hour SMA, around the $1834-33 region and staged a modest intraday bounce on Thursday. The uptick, however, lacked any strong follow-through and the commodity was last seen trading in the neutral territory through the mid-European session, just below the $1845 level.
From a technical perspective, the XAU/USD on Wednesday stalled its recent recover from two-month lows, around the $1785 region and faced rejection near the very important 200-day SMA. The subsequent fall suggested that the positive momentum might have already run out of the steam amid the risk-on mood.
That said, the emergence of some dip-buying on Thursday warrants some caution for aggressive bearish traders. This makes it prudent to wait for some follow-through selling below the 200-hour SMA support, or daily swing lows before positioning for any meaningful slide for the non-yielding yellow metal.
A convincing breakthrough now seems to accelerate the fall towards intermediate support levels near the $1818 region and the $1810 area. The downward trajectory could further drag the XAU/USD back towards the $1800 mark en-route the $1785 region and November 2020 lows, around the $1765 zone.
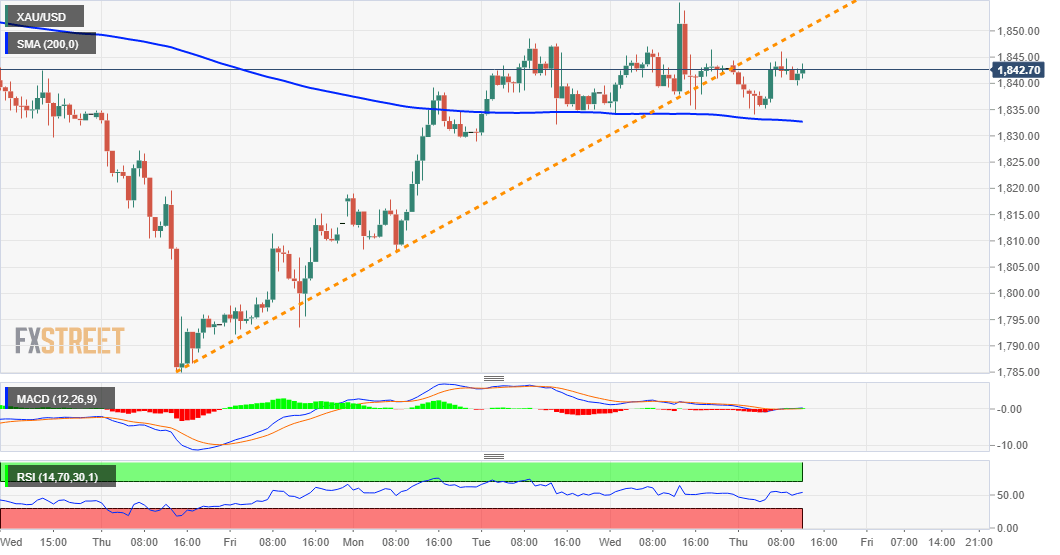
On the flip side, immediate resistance is pegged near the $1847-48 region, above which the dollar-denominated commodity is likely to make a fresh attempt to clear the 200-DMA barrier. The XAU/USD might then aim to challenge the next relevant hurdle near the $1875-76 heavy supply zone.
XAU/USD 1-hourly chart
Technical levels to watch
