GBP/USD rose to fresh multi-year highs soon before press time, extending previous week’s 0.865 gains.
The pair rose to 1.3901, the highest level since April 2018.
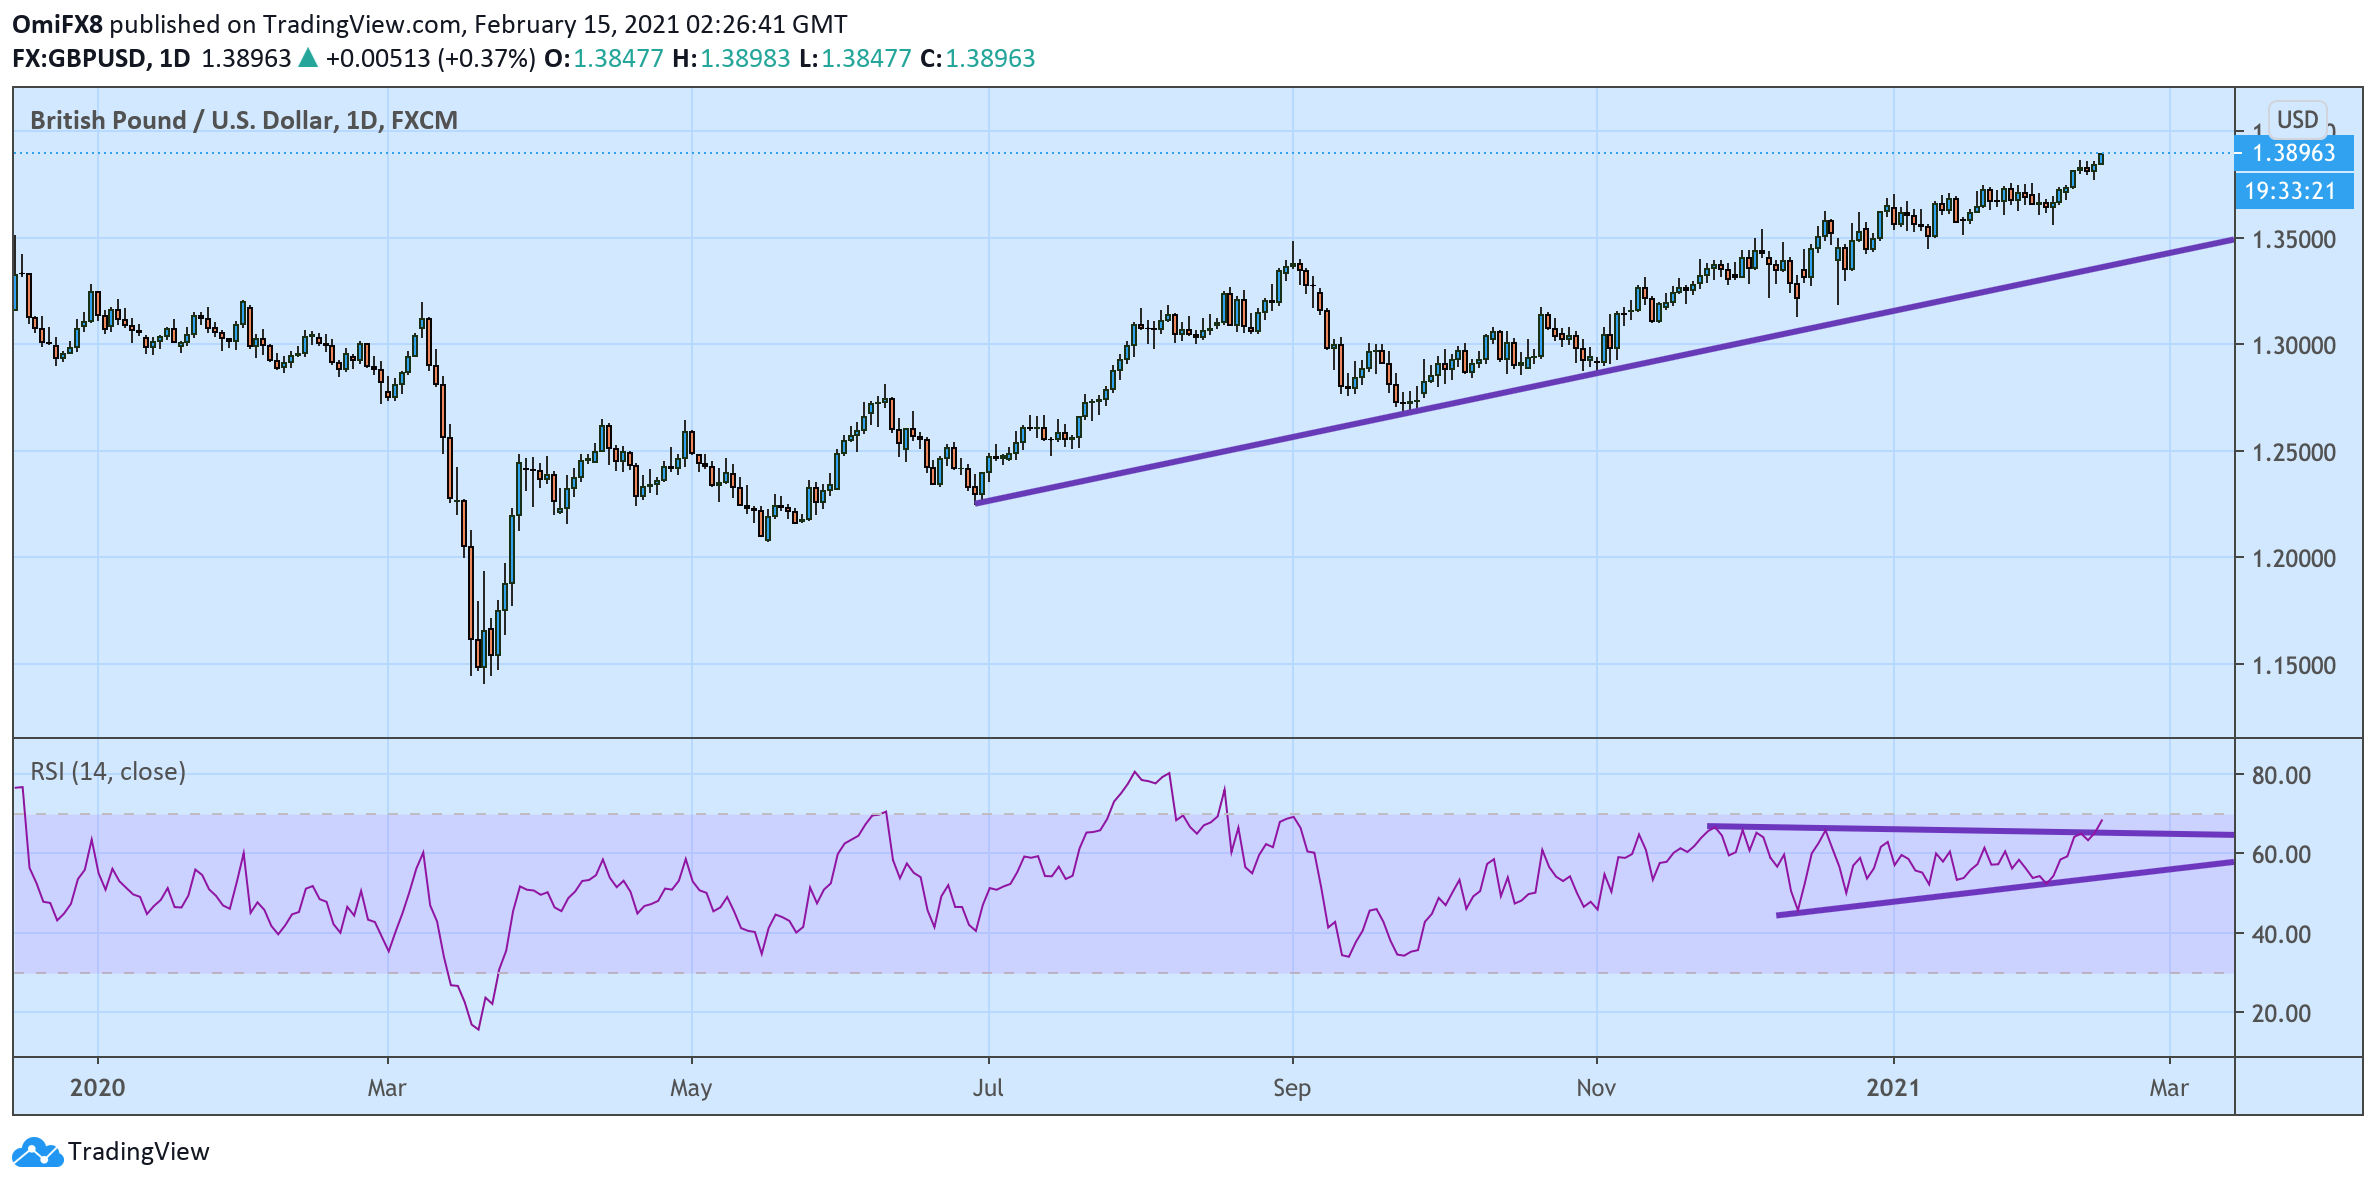
The pair’s 14-day Relative Strength Index has broken higher from a 2.5-month contracting triangle, indicating a continuation of the rally from September lows below 1.27.
The 50-, 100-, and 200-hour Simple Moving Averages are trending north and located one above the other in favor of the bulls. Lastly, the daily chart shows a bullish higher lows, higher highs pattern.
As such, a sustained move above 1.39 looks likely. That would expose the psychological hurdle of 1.40. On the downside, the hourly chart’s higher low of 1.3845 is a key support.
Daily chart
Trend: Bullish
Technical levels
