- CAD/JPY’s bullish extension is compelling for a fading opportunity.
- Bears on the lookout for bearish technical conditions on the 4-hour chart.
Further to the prior analysis, The Chart of the Week: CAD/JPY bulls seeking upside continuation, the price did indeed shoot higher from an hourly 38.2% Fibonacci retracement, extending from a low of 82.656 to a high of 83.398.
The following is a top-down analysis that now focusses on the downside and in monitoring for the next bearish opportunity.
As a recap, the prior analysis explained that the price was expected to run to at least an 82.90 target as follows:
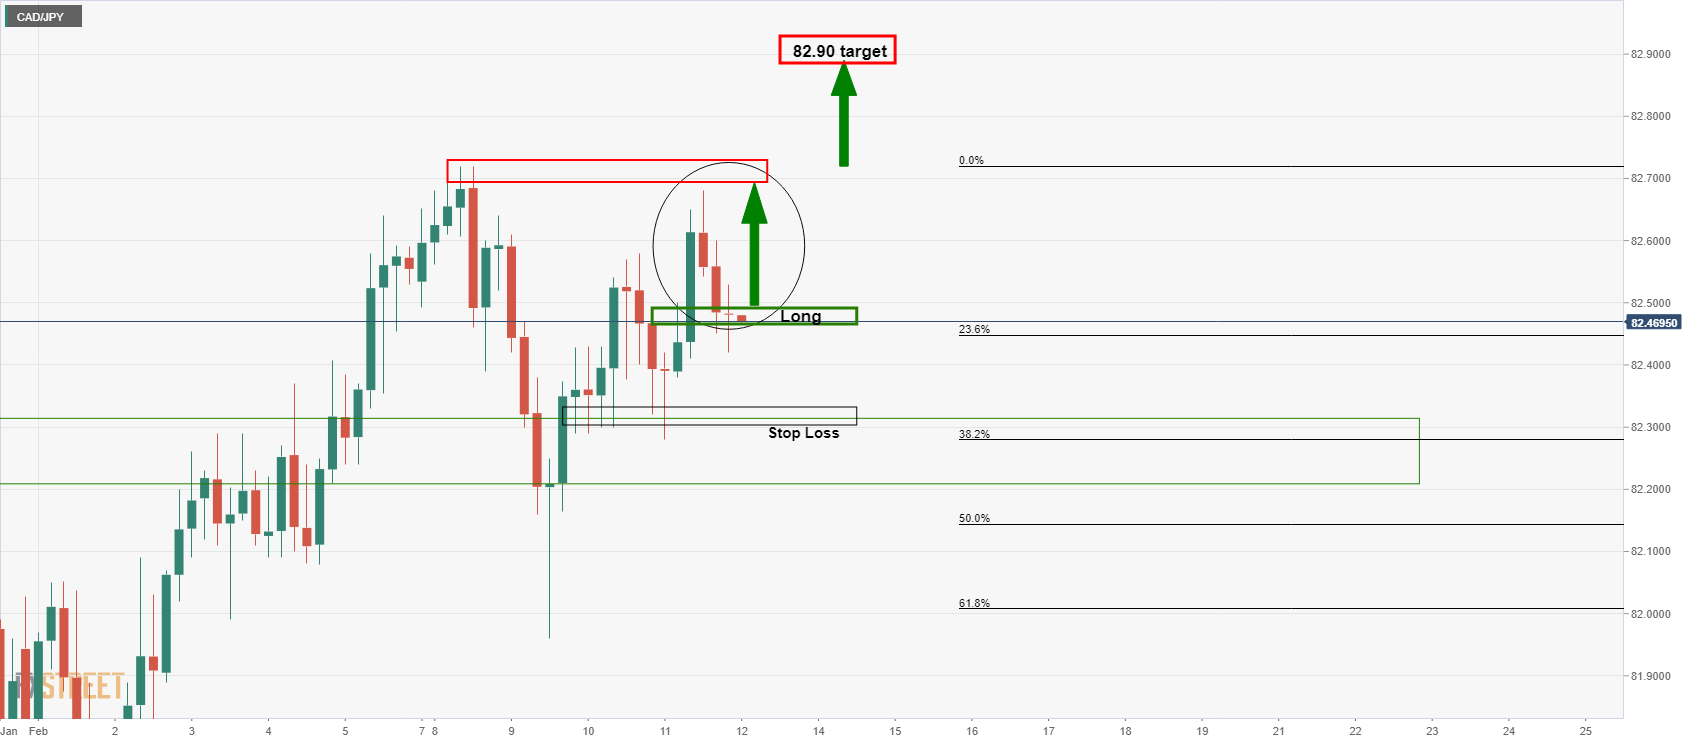
The 4-hour chart above was from the analysis CAD/JPY Price Analysis: Bulls stepping in at a discount within long-term bullish trajectory.
A subsequent opportunity presented itself on a 1-hour basis at the start the week as well:
-637489261600482169.png)
Live market, daily chart
-637490200387761356.png)
As illustrated, the price has rallied and would now be expected to retrace to a prior resistance level, which, in this case, has a confluence with a 50% mean reversion level.
However, while the market’s technical conditions remain bullish, there is nothing to do but monitor for a downside opportunity from a deceleration in momentum.
-637490203681621681.png)
In the 4-hour chart above, however, there will need to be a bearish structure formed and that may take some time to develop over the forthcoming sessions, so should stay on the watchlist.
Weekly W-formation
From a weekly point of view, a downside correction is expected to meet the neckline of the W-formation’s pattern as follows:
-637490207894389539.png)
The neckline has a confluence of the 50% mean revision which offers an additional layer of conviction to the support level and target. However, as explained, 4-hour bearish conditions need to be met before bears should contemplate such a trade setup.
