- GBP/USD bulls take a breather before the next push higher.
- Path of least resistance appears north, the hourly chart suggests.
- A test of 1.3945 on the cards after the horizontal trendline taken out.
GBP/USD has paused its two-day rally to 34-month highs above 1.3900, as the bulls gather more energy to start afresh northwards.
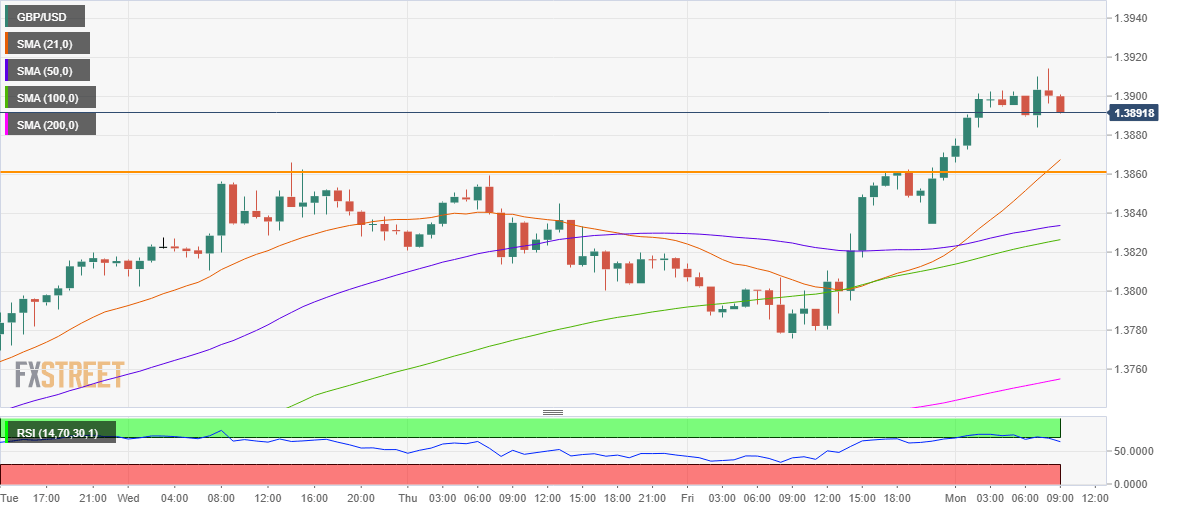
The price witnessed a vertical rise after it took out the critical horizontal trendline resistance at 1.3860, validating a rounding bottom formation on the hourly chart.
The measured target is seen at 1.3945, with the cable now trading around 1.3893, as of writing. The spot hit the highest levels since April 2018 at 1.3914 in the last hour, having gained as much as 0.50% so far.
The bull cross spotted on the given timeframe, with the 21-hourly moving average (HMA) cutting the 50-HMA from below, added credence to the upside break in the major.
Acceptance above 1.3945 could expose the psychological level at 1.4000.
The relative strength index (RSI) has retraced from the overbought territory but remains within the bullish region, suggesting that there could be another uptick in the making.
On the other hand, the spot is likely to find immediate support at the bullish 21-HMA, now at 1.3867.
The next cushion is seen at 1.3860, the horizontal trendline resistance now support. Further south, the daily low of 1.3849 could be challenged.
GBP/USD: Hourly chart