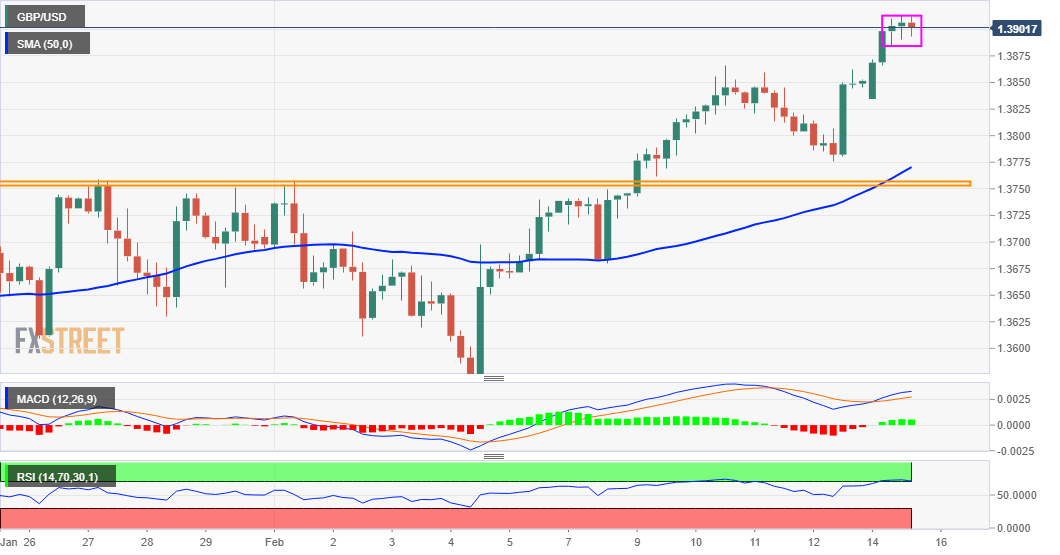
- GBP/USD was seen consolidating its recent strong gains to 34-month tops.
- The set-up favours bullish traders and supports prospects for further gains.
- A break below the 1.3755-60 region is needed to negate the positive bias.
The GBP/USD pair consolidated its recent strong gains to the highest level since April 2018 and was seen oscillating in a range above the 1.3900 mark through the mid-European session. Slightly overbought RSI on short-term charts seemed to be the only factor that held bulls from placing fresh bets and capped the upside for the major.
Meanwhile, the rangebound price action constitutes the formation of a rectangle on the 1-hourly chart. A rectangle is usually considered as a continuation pattern that marks a brief pause in the trend – bullish in this case. This, along with the emergence of some dip-buying on Friday, supports prospects for an extension of the upward trajectory.
The bullish outlook is further reinforced by the prevalent selling bias surrounding the US dollar, which remains depressed on the back of the underlying bullish sentiment in the financial markets. Hence, a subsequent move towards the 1.3960 intermediate resistance, en-route the key 1.4000 psychological mark, now looks a distinct possibility.
On the flip side, weakness below the lower bound of the triangle, around the 1.3880 region, could accelerate the slide towards horizontal support near mid-1.3800s. Any subsequent fall might still be seen as a buying opportunity near the 1.3800 round-figure mark. This, in turn, should help limit the downside near the 1.3760-55 resistance breakpoint.
A convincing break below the latter might negate the positive outlook and indicate that the GBP/USD pair has topped out in the near-term, which should prompt some aggressive long-unwinding trade.
GBP/USD 4-hourly chart
Technical levels to watch
