- USD/INR bounces off 11-month low but bears keep the reins.
- Sustained break of 61.8% Fibonacci retracement, absence of oversold RSI suggest further weakness.
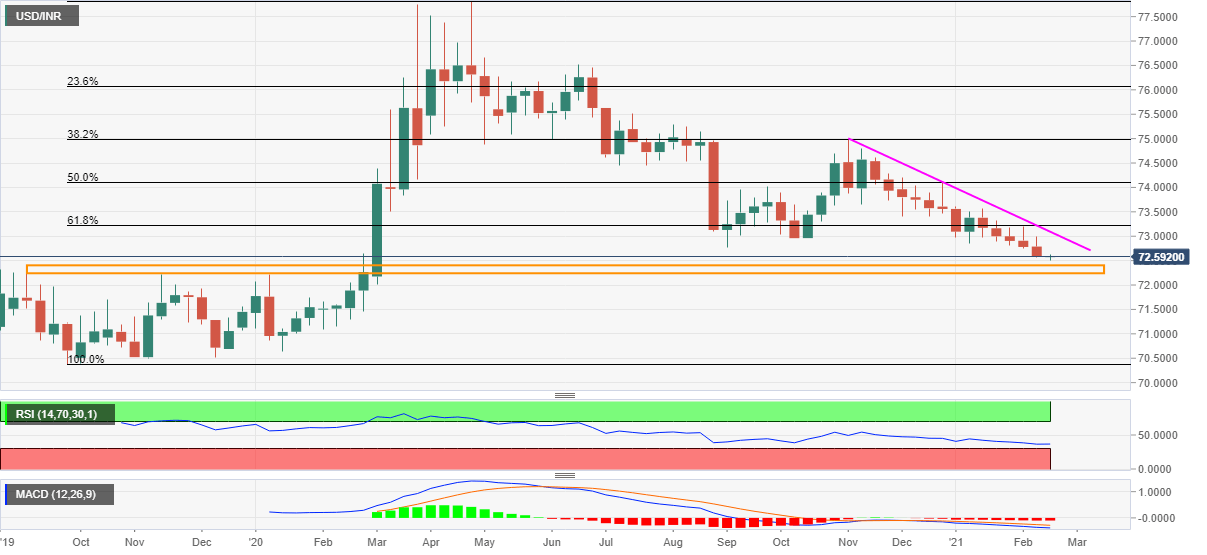
- Three-month-old resistance line offers immediate resistance ahead of the key Fibonacci retracement level.
- Highs marked since September 2019 challenge the bears.
USD/INR attempts short-covering moves while picking up the bids near 72.60 during the initial hour of Monday’s Indian session. In doing so, struggles to recover from the lowest since March 2020, marked early in Asia.
It should, however, be noted that the USD/INR keeps a downside break of 61.8% Fibonacci retracement of its September 2019 to April 2020 upside.
The bearish signal also joins downbeat MACD and no oversold RSI to suggest a further gap to the south for the Indian rupee pair.
Though, an area including highs marked since September 2019, around 73.38-22, will challenge the USD/INR bears as the RSI may also turn oversold near to that, if not then the 72.00 threshold should return to the chart.
Meanwhile, a downward sloping trend line from early November 2020 guards the pair’s immediate upside around 73.10.
In a case where the USD/INR buyers manage to cross 73.10 on a weekly closing basis, a 61.8% Fibonacci retracement level of 73.21 will holds the gate for the pair’s run-up towards the mid-January peak surrounding 73.55.
USD/INR weekly chart
Trend: Further weakness expected
