- EUR/JPY rises to multi-year highs, marking a strong follow-through to Monday’s breakout.
- The daily chart indicators suggest scope for further gains.
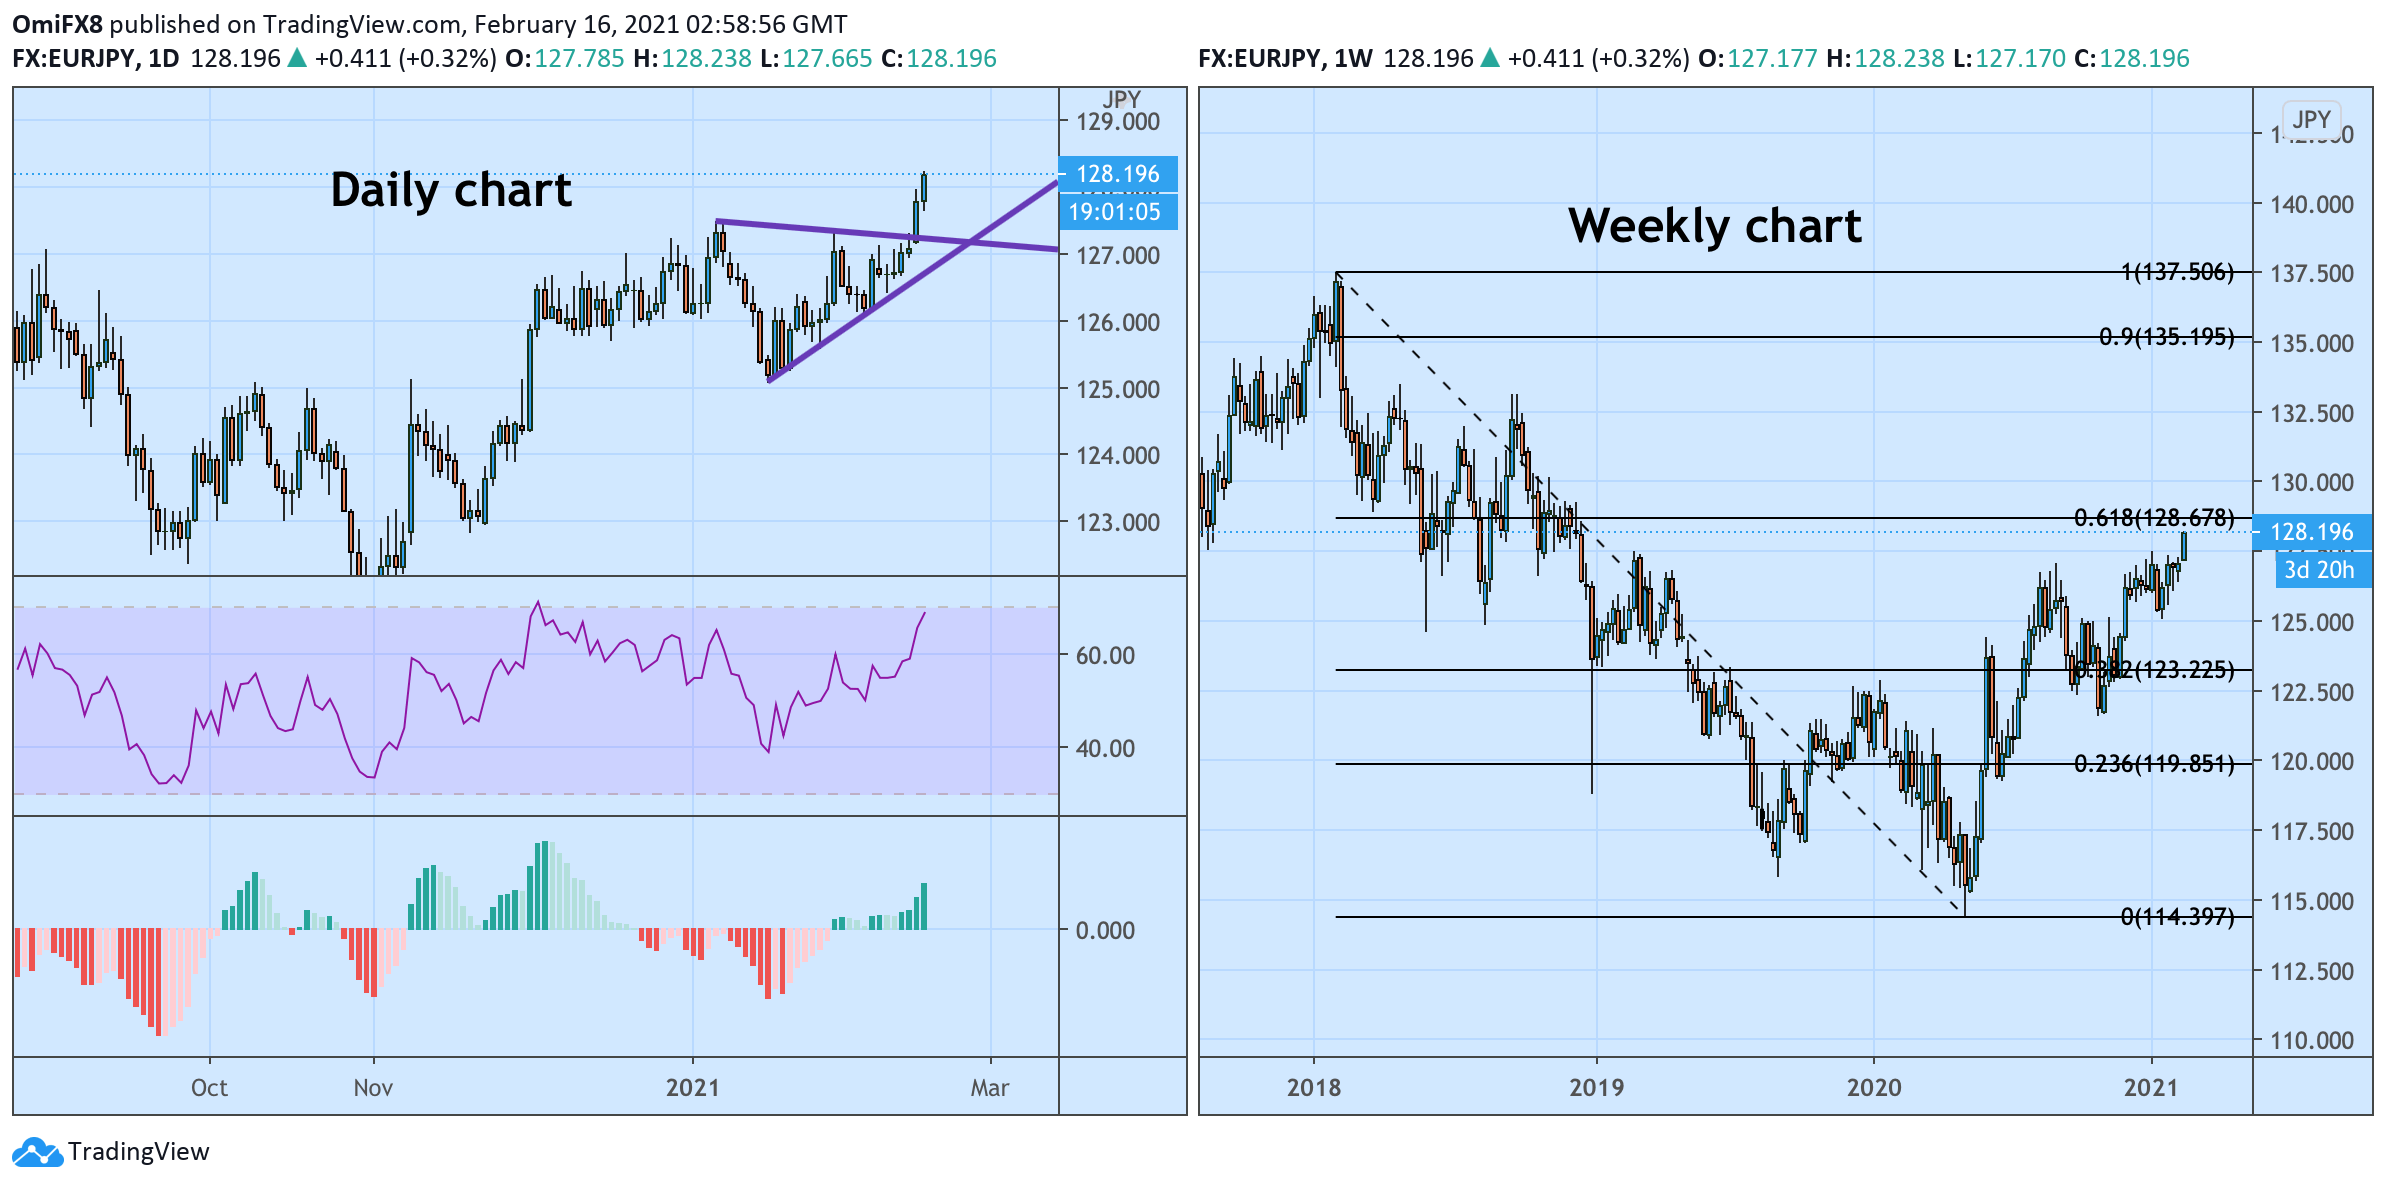
EUR/JPY has crossed above 128.00 to hit the highest level since December 2018, having confirmed a symmetrical triangle breakout – a bullish continuation pattern on the daily chart – with a 0.55% gain on Monday.
The breakout is backed by an above-50 or bullish reading on the 14-day Relative Strength Index. The MACD histogram, an indicator used to identify trend changes and trend strength, is producing higher bars above the zero line, indicating a strengthening of the upward momentum.
The 5- and 10-day Simple Moving Averages are trending north, indicating a bullish setup.
As such, the pair looks set to test resistance at 128.68 – the 61.8% Fibonacci retracement of the sell-off from 137.51 to 114.40.
A break below the higher low of 126.10 created on Feb. 4 is needed to confirm a reversal lower.
Daily and weekly charts
Trend: Bullish
Technical levels
