- NZD/USD bulls seeking a break of 0.7800 in contrast to the monthly doji.
- Bears look for a break of strong support within the trapped scenario on the daily chart.
The price of the New Zealand dollar is reluctant to move lower from a longer-term analysis.
The following is a top-down illustration of the price action to date and market structure which offers a trapped scenario on the daily chart.
Monthly chart
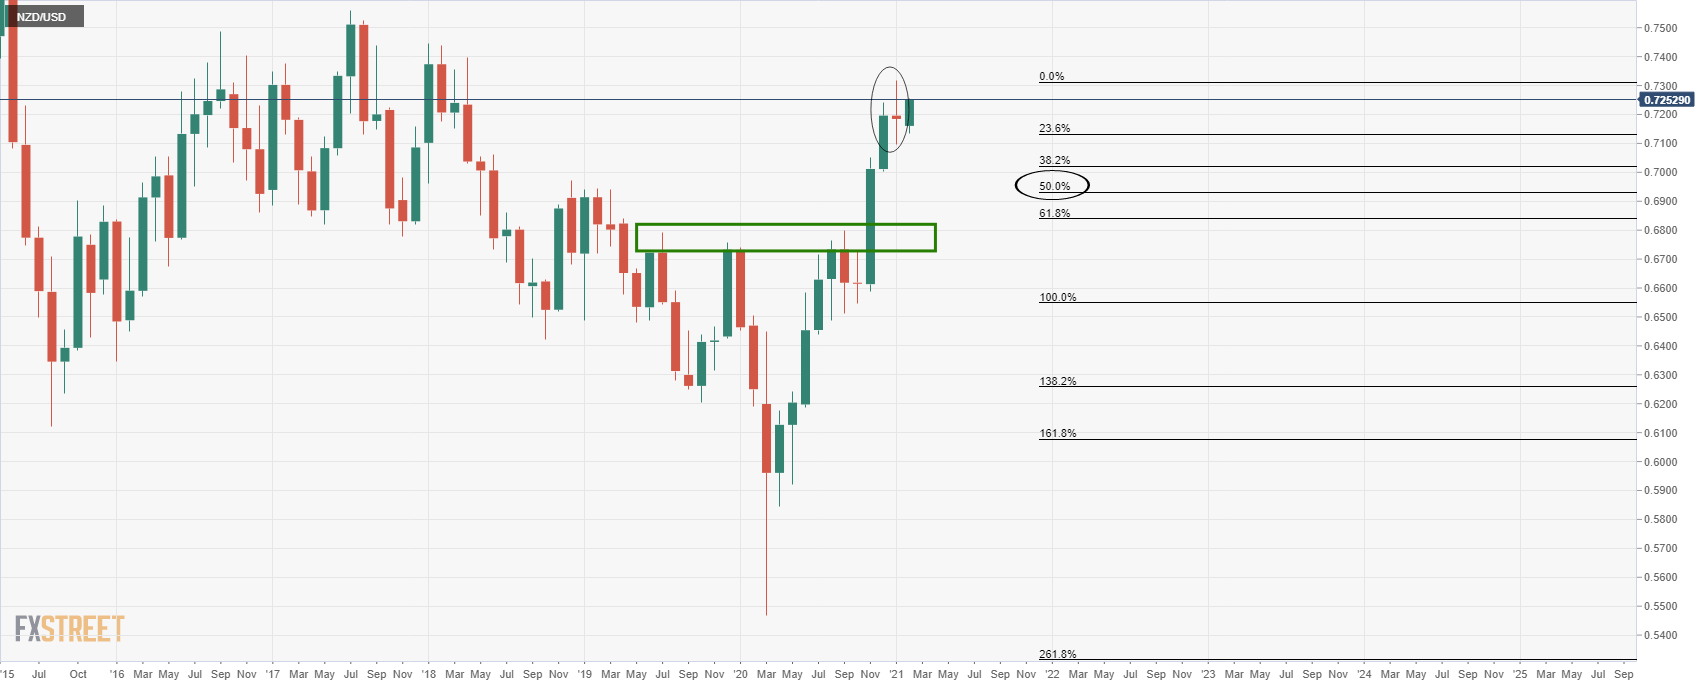
The weekly doji has not been followed by mush in the way of selling pressure and while the price tests resistance, there is little bearish about the candle sticks pattern so far for the month of Feb.
Weekly chart
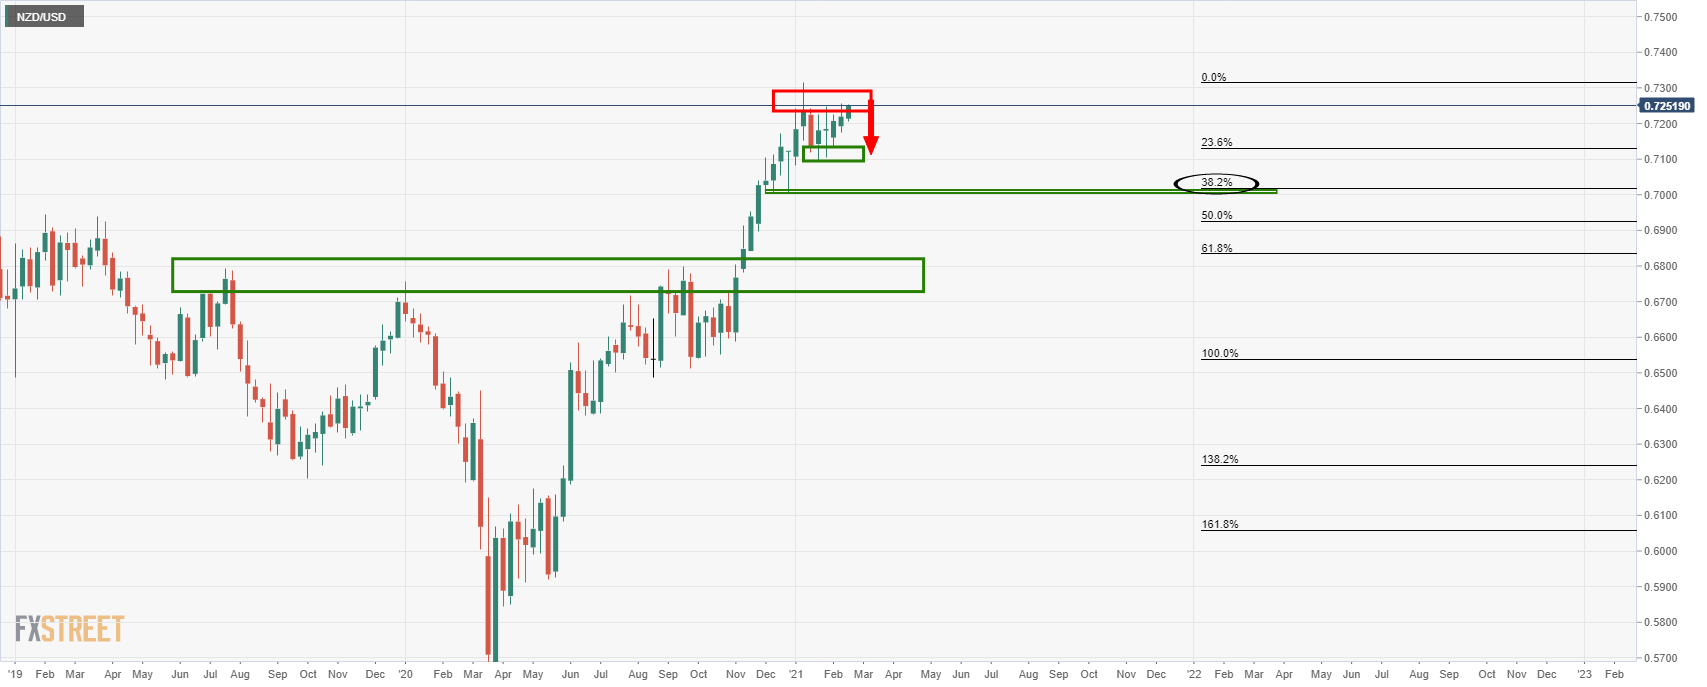
The bulls have been supported ahead of a fuller retracement to the 38.2% Fibonacci level, denying bears a free lunch.
Daily chart
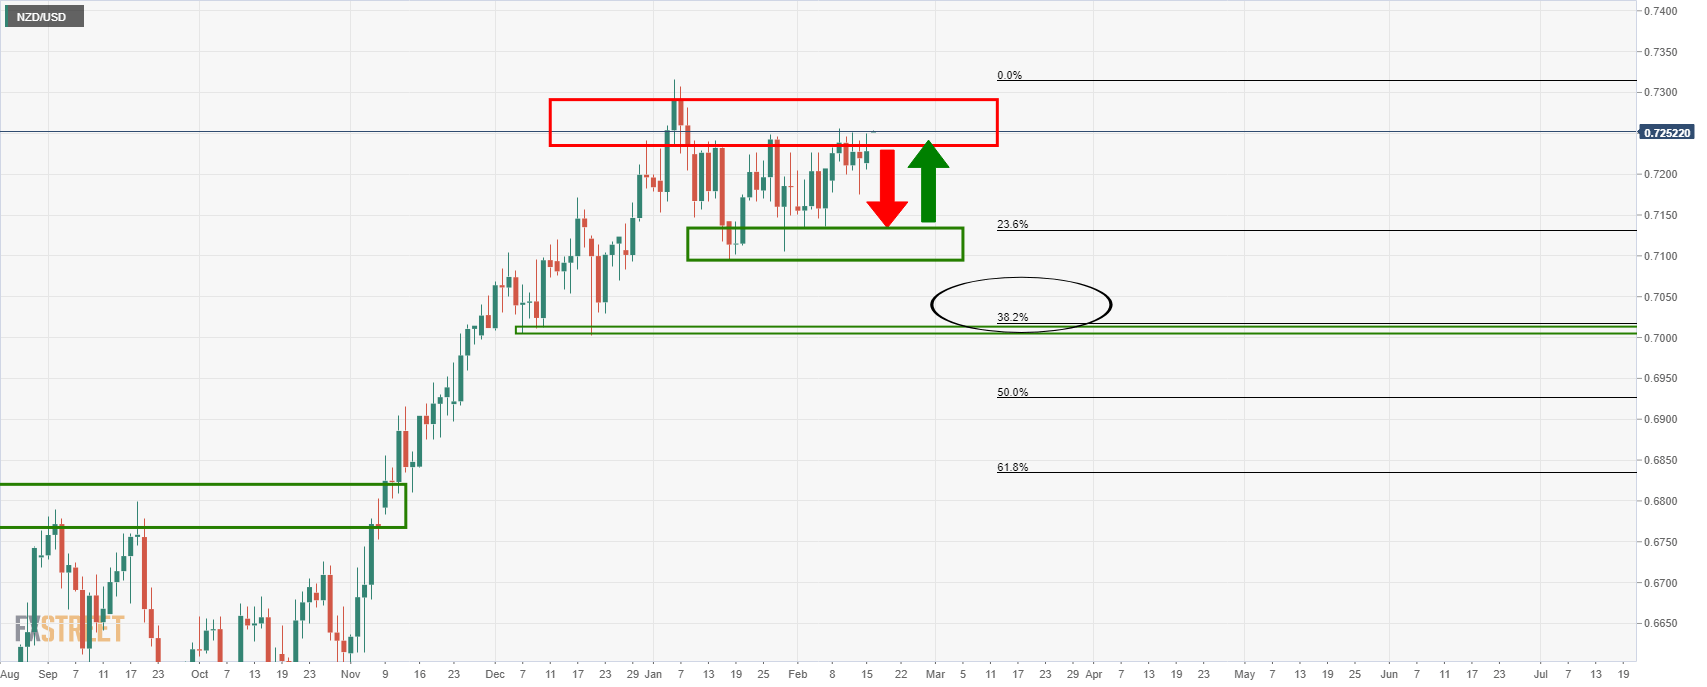
The trapped scenario may offer day trading opportunities within the sideways channel, but there are no high probability set-ups at the time of writing, at least from a daily point of view.
