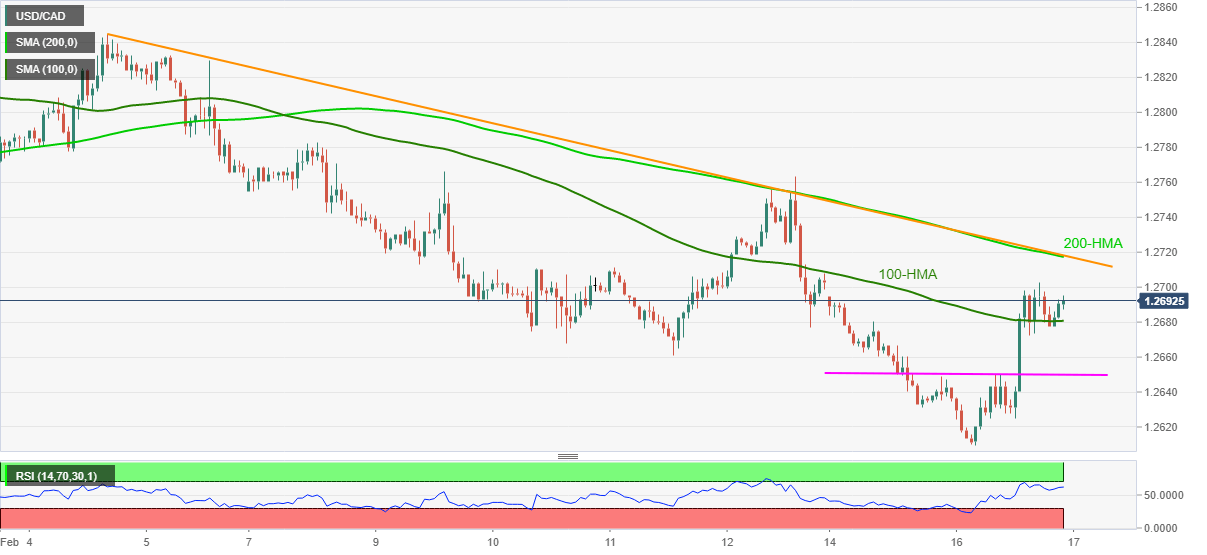
- USD/CAD keeps upside break of 100-HMA, attack the immediate range resistance.
- Strong RSI suggests further upside, 1.2720 become the key hurdle.
- Weekly horizontal support restricts the short-term seller’s entry.
USD/CAD picks up bids around 1.2690 while trying to extend the previous day’s upside momentum during the initial Asian session on Wednesday. In doing so, the quote holds above 100-HMA amid the strong RSI conditions.
However, a confluence of 200-HMA and a downward sloping trend line from February 04, currently around 1.2720, question the pair’s further upside. Also acting as the key resistance is Friday’s top near 1.2765.
In a case where the USD/CAD bulls hold controls above 1.2765, the 1.2800 and the monthly top around 1.2845 will be on their radar.
Meanwhile, pullback moves need to break 100-HMA support, at 1.2680 now, before directing the sellers toward the horizontal line near 1.2650.
Should USD/CAD sellers break 1.2650, the price-drop below the monthly low of 1.2609, flashed on Monday, can’t be ruled out.
USD/CAD hourly chart
Trend: Pullback expected
