- WTI keeps the previous day’s pullback moves from January 2020 top.
- Bearish MACD signals suggest further consolidation of gains from the multi-month high.
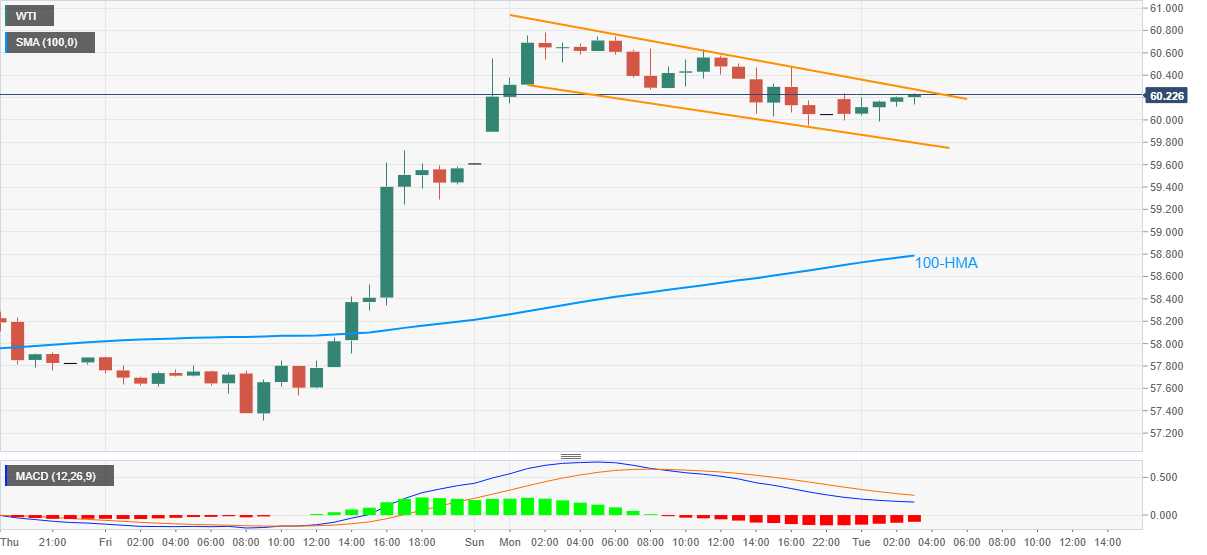
- 100-HMA adds to the downside filter, bulls can eye September 2019 peak on confirming the bullish chart pattern.
WTI picks up bids around $60.20, up 0.24% intraday, amid the initial Tuesday. In doing so, the energy benchmark extends consolidation moves, portrayed during the late Monday, near the highest in 13 months.
It should be noted that the energy benchmark portrays a bullish flag pattern on the hourly (H1) chart that teases the breakout of the flag.
However, MACD indicates that the oil buyers may have to wait for a confirmation of the bullish chart pattern, via a sustained break beyond $60.30.
On a sustained up-move past-$60.30, the recent high of $60.78 can offer an intermediate halt before propelling the quote towards September 2019 high near $63.15 and then to 2020 peak surrounding $65.45.
Meanwhile, a downside break of the immediate falling channel, part of the bullish chart pattern, at $59.80 now, should stretch the commodity’s dull performance to highlight 100-HMA support of $58.78. Though, any further weakness will become the cause of concern and may drag the black gold towards the monthly low of $51.60.
To sum up, oil buyers catch a breather inside a bullish chart formation, which in turn terms the latest pullback in WTI prices as only a consolidation.
WTI hourly chart
Trend: Bullish
