- Gold stays heavy near two-week low, flirts with key support.
- Bearish MACD sustained trading below short-term SMA favor sellers.
- 21-day SMA, six-week-old resistance line challenges the bulls.
Gold prices fade bounce off intraday low of $1,786.72, also the lowest since February 04, during the early Wednesday. In doing so, the bullion drops for the fifth consecutive day while trying to break an upward sloping trend line from November 30.
Considering the metal’s failure to remain above 21-day SMA and the key short-term falling trend lines amid bearish MACD, gold is likely to break the $1,790 immediate support line.
Following that, the quote drops towards the November 2020 bottom surrounding $1,765 wherein the monthly low around $1,785 adds a filter to the downside.
It’s worth mentioning that any clear downside past-$1,765 will eye for the April 2020 peak near $1,748.
Meanwhile, pullback moves can find the $1,800 as an immediate hurdle ahead of the convergence of 21-day SMA and a descending trend line from January 06, currently around $1,835.
It should, however, be noted that gold’s upside beyond $1,835 needs validation from the monthly resistance line of $1,843.
Gold daily chart
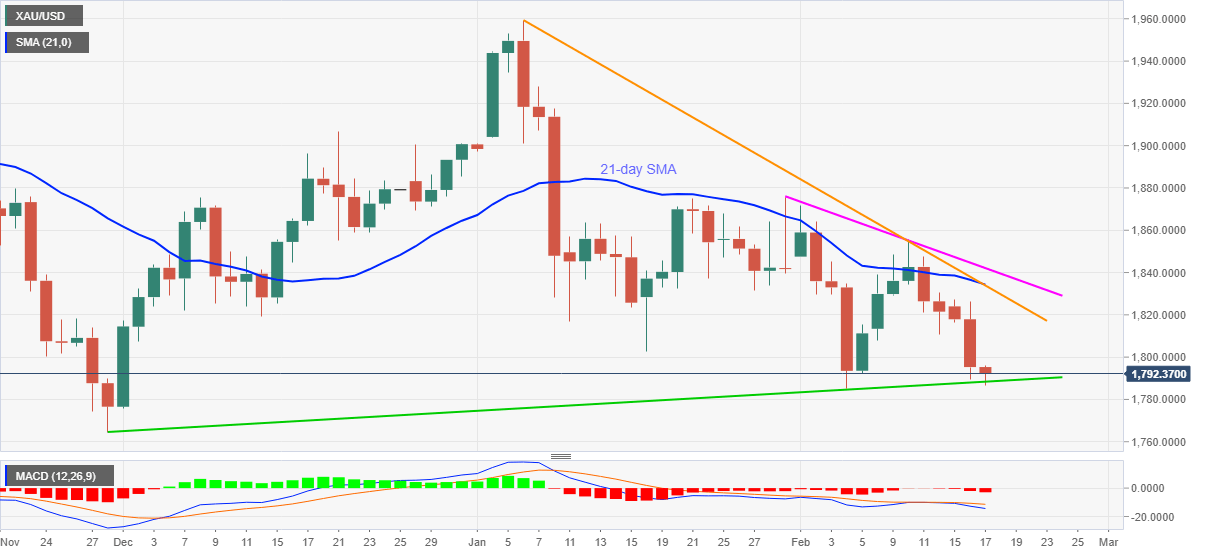
Trend: Bearish
