Gold has suffered a fresh blow from US Retail Sales – Americans expanded their expenditure by no less than 5.3% in January, far above expectations. The robust data has triggered yet another sell-off in bonds, sending yields to above 1.3%. Contrary to Treasuries, the precious metal does not provide any returns and is thus less attractive.
In the meantime, President Joe Biden continues pushing his massive $1.9 trillion coronavirus relief bill. Will it push yields even higher or will the cash flow into gold?
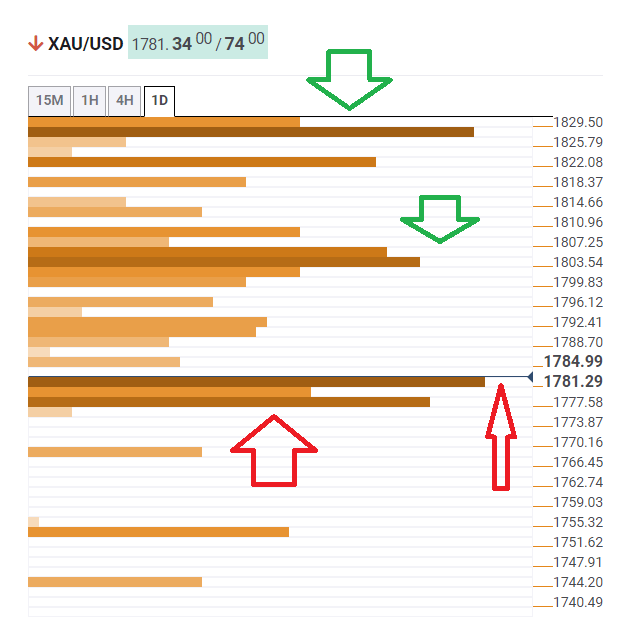
In the meantime, here is how XAU/USD is positioned on the charts.
The Technical Confluences Indicator is showing that gold has critical support at $1,781, which is the convergence of the Simple Moving Average 5-15m, the Pivot Point one-week Support 2, the PP one-day S1 and more.
It is closely backed up by $1,777, which is where the Bollinger Band 15min-Lower and the PP one-month S1 meet up.
Looking up, resistance awaits at $1,803, which is the confluence of the previous monthly low and the Fibonacci 38.2% one-day.
The upside target if things substantially turn around, is at $1,825, where the Fibonacci 61.8% one-week, the previous daily high and the SMA 50-4h all hit the price.
XAU/USD resistance and support levels
Confluence Detector
The Confluence Detector finds exciting opportunities using Technical Confluences. The TC is a tool to locate and point out those price levels where there is a congestion of indicators, moving averages, Fibonacci levels, Pivot Points, etc. Knowing where these congestion points are located is very useful for the trader, and can be used as a basis for different strategies.
Learn more about Technical Confluence
