- DXY adds to the recent upside and approaches 91.00.
- The next significant hurdle is located around 91.60.
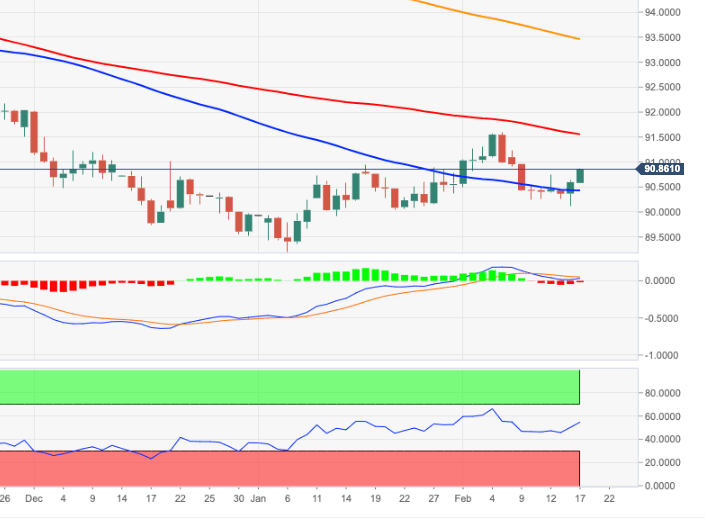
After testing the 2020-2021 support line in the 90.30/40 area, DXY embarked on an upside move that now trades at shouting distance from the key barrier near the 91.00 yardstick.
If the upside impulse picks up pace the next target of note comes in at the so far 2021 highs around 91.60 (February 5). This area of resistance is reinforced by the proximity of the 100-day SMA (91.56).
However, occasional bouts of upside pressure in the index are deemed as corrective only amidst the broader bearish view on the dollar. That said, bullish attempts to the 91.00 hurdle and beyond could represent selling opportunities against the current backdrop.
In the longer run, as long as DXY trades below the 200-day SMA (93.45), the negative stance is expected to persist.
DXY daily chart