- USD/JPY consolidates the latest surge to five-month tops.
- Bull cross on the hourly chart, bullish RSI remain supportive.
- Buyers target 106.50, with a focus on US Retail Sales and Fed minutes.
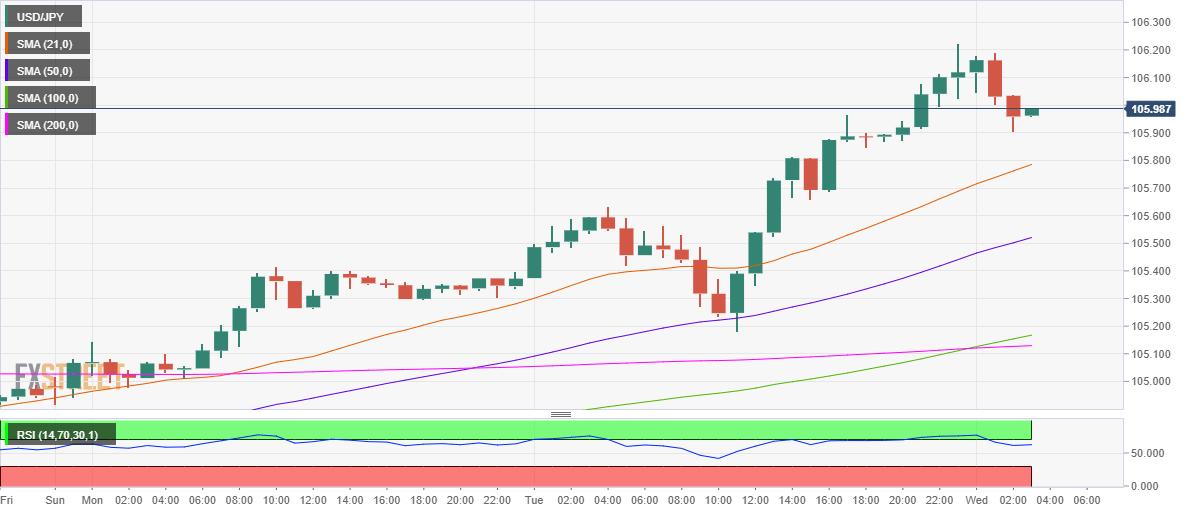
USD/JPY pulled back from five-month highs of 106.22, now consolidating around 106.00, as the bulls gather pace for the next leg higher.
The surge in the spot could be mainly associated with the rally in the US Treasury yields, as the domestic bonds took a beating amid fears of faster global inflation. The vaccine and stimulus optimism are spurring a wave of global reflation trades.
The advance is the US Treasury yields saved the day for the US dollar bulls, offering further support to the move higher in USD/JPY.
From a short-term technical perspective, the major remains on track to retest the multi-month highs above 106.22, with the next upside target aligned at 106.50, depending on the US Retail Sales data and FOMC minutes.
The upbeat outlook is backed by the bull cross formed on the hourly sticks after the 100-hourly moving average (HMA) pierced the 200-HMA from below.
Further, the hourly relative strength index (RSI) trades firmer just beneath the overbought territory, rendering positive for the pair.
To the downside, the bullish 21-HMA at 105.78 would offer immediate support, below which Tuesday’s low of 105.18 could be challenged.
USD/JPY: Hourly chart
USD/JPY: Additional levels
