- AUD/NZD eases from one-month high but the pullback fades off-late.
- RSI fades upside momentum near overbought region, signaling pullback from key hurdles.
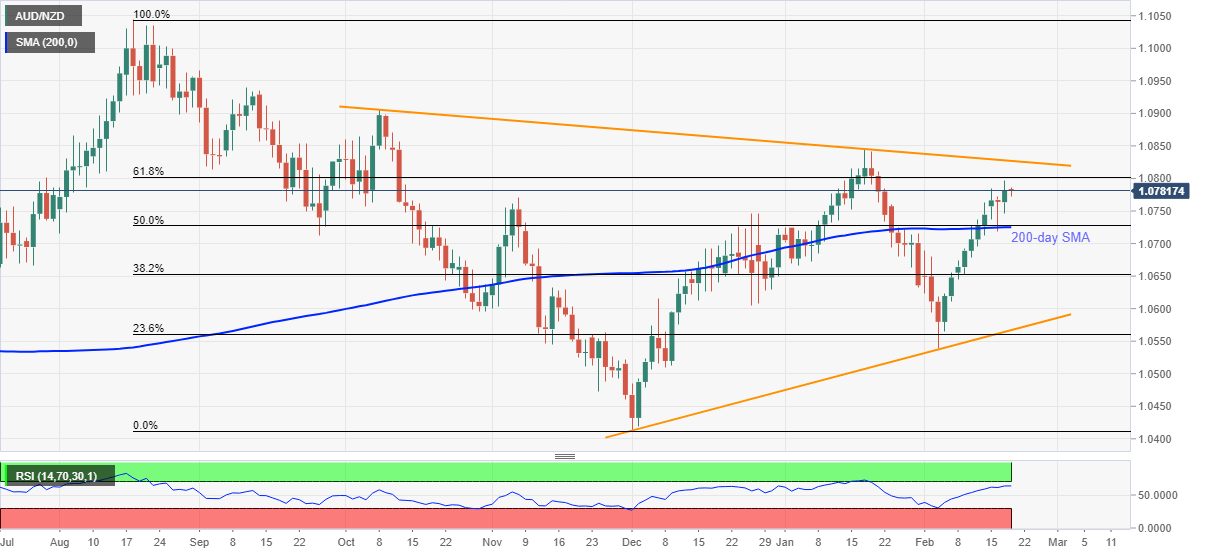
- Confluence of 200-day SMA, 50% Fibonacci retracement restrict immediate downside.
- Aussie employment data bears mixed forecasts, RBA pessimism.
AUD/NZD bulls catch a breather around 1.0780 during Thursday’s Asian trading session. In doing so, the quote eases from the highest since January 21, marked on Wednesday, while nearing the key resistances ahead of Australia’s January month employment data.
Read: AUD/USD: Corrective pullback to mid-0.7700s eyes Australian Employment data for fresh fuel
The mixed forecasts and RBA’s downbeat view on jobs may weigh on the AUD/NZD prices. However, strong RSI and the quote’s ability to stay beyond a convergence of 200-day SMA and 50% Fibonacci retracement level of August-December 2020 downside, around 1.0720, keep the buyers hopeful.
Though, the RSI line is mostly flat near the overbought conditions and the AUD/NZD proximity to the 61.8% Fibonacci retracement level and a falling trend line from October 2020, respectively around 1.0800 and 1.0830, challenge the bulls.
In a case where the quote jumps beyond 1.0830, the yearly top surrounding 1.0845 and October 2020 peak near 1.0910 should return to the chart.
On the contrary, a downside break of 1.0720 support confluence can drag the AUD/NZD below 38.2% Fibonacci retracement level near 1.0650 but an ascending support line from December 01, 2020, close to 1.0565, will be important to watch afterward.
Overall, AUD/NZD remains in the uptrend but the bulls may step back if the scheduled Aussie data disappoint.
AUD/NZD daily chart
Trend: Pullback expected
