- A combination of supporting factors assisted gold to regain some positive traction on Thursday.
- The set-up remains in favour of bearish traders and supports prospects for further weakness.
- Sustained strength beyond the $1800 confluence hurdle is needed to negate the bearish outlook.
Gold held on to its modest recovery gains through the early North American session and refreshed daily top, around the $1789-90 region in the last hour, albeit lacked follow-through.
A modest pullback in the US Treasury bond yields assisted the non-yielding yellow metal to stage a modest bounce from two-and-half-month lows and snap five consecutive days of the losing streak. Apart from this, the emergence of some fresh selling around the US dollar provided an additional boost to the dollar-denominated commodity.
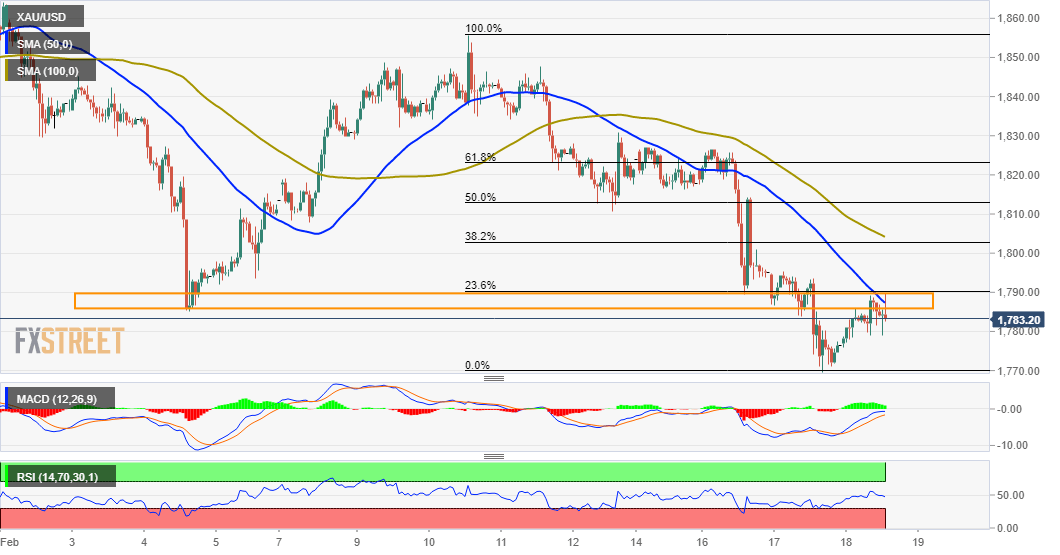
From a technical perspective, the XAU/USD recovered a part of the previous day’s losses, though struggled to move back above the previous monthly swing lows, near the $1785 region. The mentioned area also marks a confluence hurdle comprising of 50-hour SMA and the 23.6% Fibonacci level of the $1856-$1770 latest leg down.
Meanwhile, the commodity’s inability to capitalize on the attempted recovery move suggests that the near-term bearish bias might still be far from being over. Moreover, technical indicators on hourly/daily charts have been struggling to gain any meaningful traction and support prospects for a further near-term depreciating move.
Hence, any further positive move might still be seen as a selling opportunity and runs the risk of fizzling out rather quickly near another confluence barrier, around the $1800 mark. This comprises 100-hour SMA and 38.2% Fibo. level, which if cleared decisively will negate the bearish bias and trigger a short-covering move.
On the flip side, the overnight swing lows, around the $1770 area might protect the immediate downside. Some follow-through selling will be seen as a fresh trigger for bearish traders and set the stage for a slide towards the $1735 region en-route the next major support near the $1727-25 horizontal zone.
Gold 1-hourly chart
Technical levels to watch
