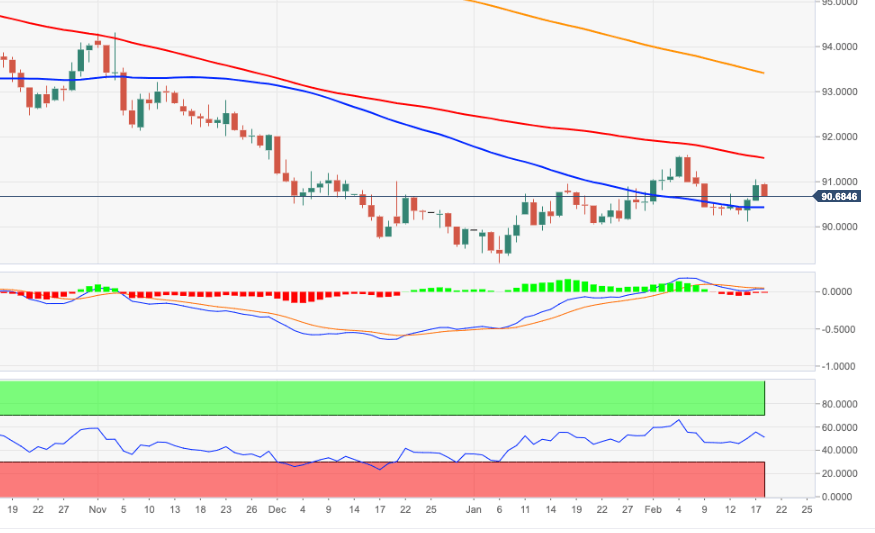
- DXY corrects lower from weekly tops just above 91.00.
- The 90.00 region still stands as a solid support.
After clinching weekly tops in levels just past the 91.00 barrier, the dollar is now facing some downside pressure and drags DXY to the 90.70/65 band.
In order to extend the recent recovery, bulls need to regain the area above 91.00 ideally in the very near-term. If that’s the case, then the next target of note comes in at the so far 2021 highs around 91.60 (February 5). This area of resistance is reinforced by the proximity of the 100-day SMA (91.53).
In the meantime, occasional bouts of upside pressure in the index are deemed as corrective only amidst the broader bearish view on the dollar. That said, bullish attempts to the 91.00 hurdle and beyond could represent selling opportunities against the current backdrop.
In the longer run, as long as DXY trades below the 200-day SMA (93.41), the negative stance is expected to persist.
DXY daily chart