- GBP/USD gained strong positive traction for the second consecutive session on Friday.
- The momentum pushed the pair to the top boundary of a short-term ascending channel.
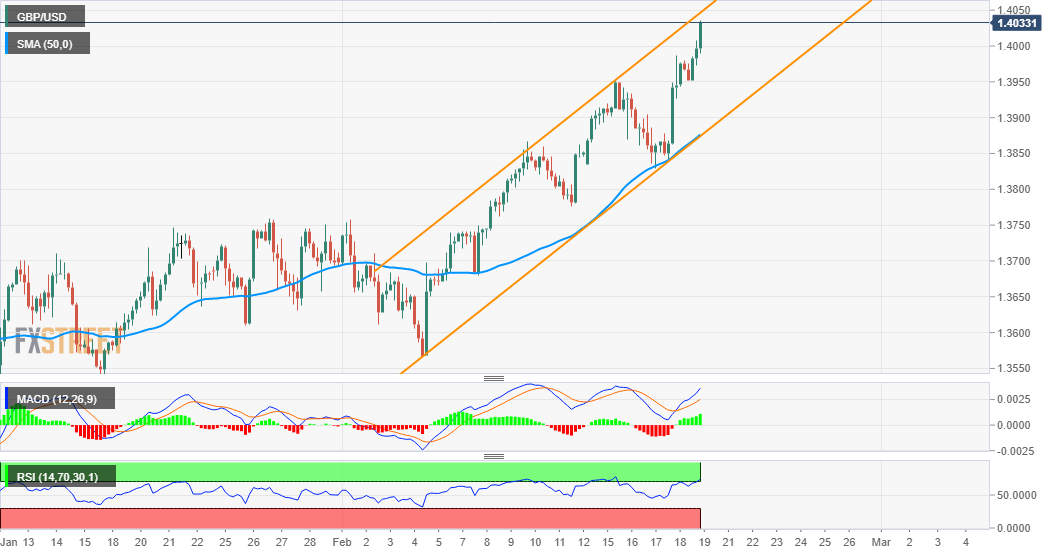
- Overbought RSI on the daily chart warrants some caution before placing fresh bullish bets.
The GBP/USD pair added to the previous day’s strong positive move and gained some strong follow-through traction for the second consecutive session on Friday. The momentum was sponsored by the heavily offered tone surrounding the US dollar and pushed the pair further beyond the key 1.4000 psychological mark during the early North American session.
From a technical perspective, the post-BoE strong move up has been along an upward sloping channel and points to a well-established short-term bullish trajectory. The GBP/USD pair was last seen hovering around the 1.4035 region, or the highest level since April 2018, which is closely followed by the top boundary of the mentioned trend-channel, around mid-1.4000s.
The RSI (14) on the daily chart has just moved above the 70 mark and flashing slightly overbought conditions. This, in turn, should hold bullish traders from placing fresh bets. This makes it prudent to wait for some near-term consolidation or a modest pullback before traders again start positioning for any further near-term appreciating move.
That said, a sustained break through the trend-channel resistance will be seen as a fresh trigger for bullish traders and set the stage for an extension of the momentum. Bulls might then aim to reclaim the 1.4100 round-figure mark.
On the flip side, the 1.4000 mark now seems to protect the immediate downside. Any subsequent fall is more likely to find decent support and might be seen as a buying opportunity near daily swing lows, around mid-1.3900s. Failure to defend the mentioned support levels might turn the GBP/USD vulnerable to slide further towards the 1.3900 confluence region.
The latter comprises of 50-period SMA on the 4-hourly chart and the channel support, which if broken will negate any near-term positive outlook. This might trigger a near-term corrective fall and drag the GBP/USD pair further towards weekly swing lows support, near the 1.3835 region touched on Thursday.
GBP/USD 4-hourly chart
Technical levels to watch
