The sell-off in bonds has resumed and money is flowing back into stocks and also gold – as the precious metal maintains its new status as a risk asset rather than a safe-haven. Will this recovery continue? A lot depends on President Joe Biden’s stimulus
In the meantime, here is how XAU/USD is positioned on the charts.
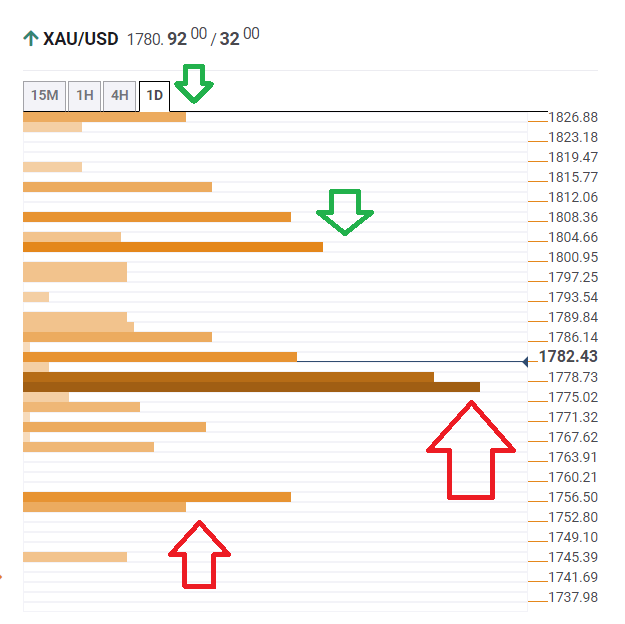
The Technical Confluences Indicator is showing that gold has overcome critical support at around $1,776, which is the convergence of the Simple Moving Average 10-4h, the Fibonacci 61.8% one-day and the Pivot Point one-month Support 1.
Further down, the next cushion awaits at $1,756, which is where the Fibonacci 161.8% one-day, the Bollinger Band 4h-Lower, and the Pivot Point one-day Support 2 all meet up.
Looking up, some resistance awaits at $1,802, which is the confluence of the PP one-week S1 and then the previous monthly low.
Beyond the horizon, the upside target is $1.826, which is a juncture including the Fibonacci 61.8% one-week and the SMA 100-4h.
XAU/USD resistance and support levels
Confluence Detector
The Confluence Detector finds exciting opportunities using Technical Confluences. The TC is a tool to locate and point out those price levels where there is a congestion of indicators, moving averages, Fibonacci levels, Pivot Points, etc. Knowing where these congestion points are located is very useful for the trader, and can be used as a basis for different strategies.
Learn more about Technical Confluence
