- Gold’s 1H chart suggests that the recovery is fizzling out.
- Rising Treasury yields outweigh the decline in the US dollar.
- RSI has turned south once again below the midline.
Gold (XAU/USD) is losing its recovery momentum in the European session, as renewed strength in the US Treasury yields negates the support derived from the decline in the US dollar across its main peers.
The hourly chart of gold points to the resumption of the recent downtrend, with bears targeting the seven-month lows of $1761.
Gold Price Chart: Hourly chart
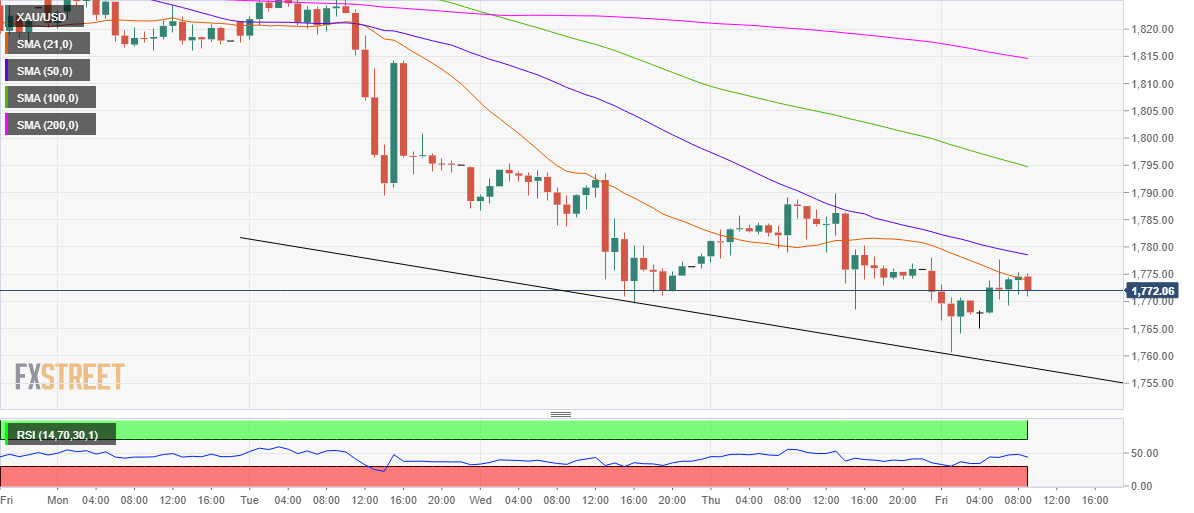
As observed on the hourly chart, gold has failed to find acceptance above the 21-hourly moving average (HMA) barrier at $1774 on its road to recovery.
Therefore, the sellers have seemed to return, as Thursday’s low of $1768 looks at risk now.
Further south, the $1760 round figure could be tested, below which the falling trendline support at $1758 could challenge the bearish commitments.
The hourly relative strength index (RSI) has turned south while trending below the midline, also suggesting that the selling pressure is intensifying once again.
To the upside, the bearish 50-HMA at $1793 could challenge the buyers’ commitments. Further up, the January low of $1803 could be tested.
Alternatively, a sustained move above the 21-HMA is needed to extend the rebound towards the bearish 50-HMA at $1779.
The next relevant resistance is aligned at $1790, Thursday’s high.
Gold: Additional levels
