- USD/CAD extends Thursday’s pullback, holds lower ground near intraday low.
- Normal RSI joins sustained trading below key SMA, trend line to suggest further downside.
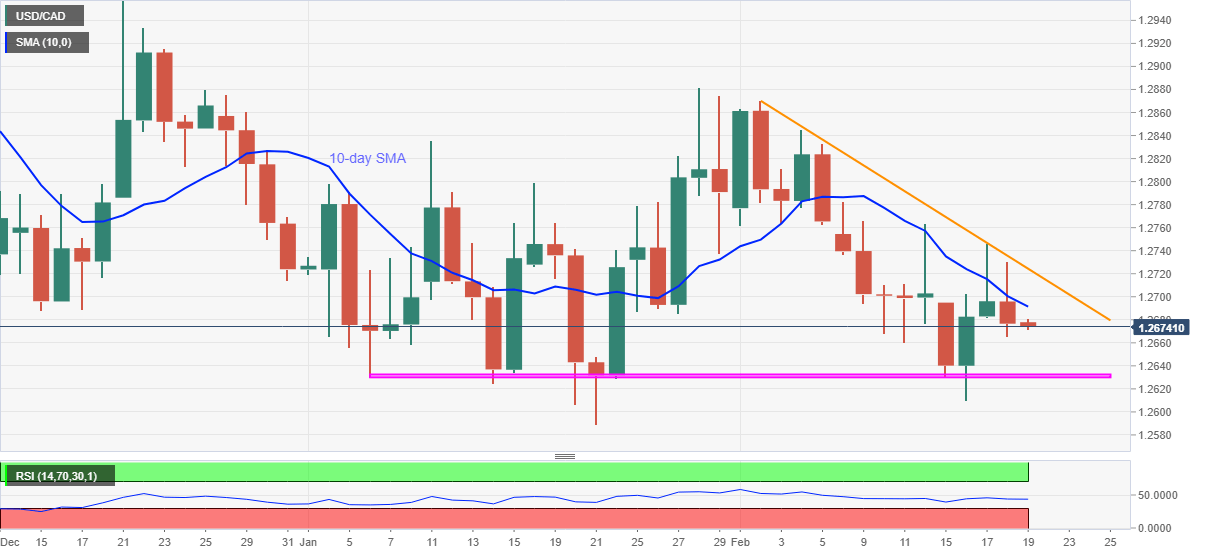
USD/CAD remains pressured while taking rounds to 1.2675, intraday low of 1.2671, during the initial Asian session trading on Friday. The pair rose to the high of 1.2731 the previous day before stepping back from the 10-day SMA one more time.
In doing so, the loonie pair remains below 10-day SMA, on a closing basis, for consecutive two weeks.
The quote’s inability to cross the 10-day SMA joins normal RSI conditions, needless to mention about the sustained trading below a descending trend line from February 02, favors the USD/CAD sellers.
As a result, a horizontal area comprising multiple lows marked since January 06, around 1.2635-30 stays on the USD/CAD bears’ radars ahead of the yearly low of 1.2589.
Alternatively, a clear break of 10-day SMA, at 1.2691 now, needs to cross the stated resistance line, currently around 1.2725, to direct USD/CAD buyers toward the 1.2800 threshold and the monthly high of 1.2870.
Overall, USD/CAD stays in a bearish trajectory but the key support around 1.2630-35 can keep challenging the bears.
USD/CAD daily chart
Trend: Bearish
