- EUR/USD’s daily chart RSI charts a bullis reversal pattern.
- The pair is yet to take out the 50-day SMA hurdle.
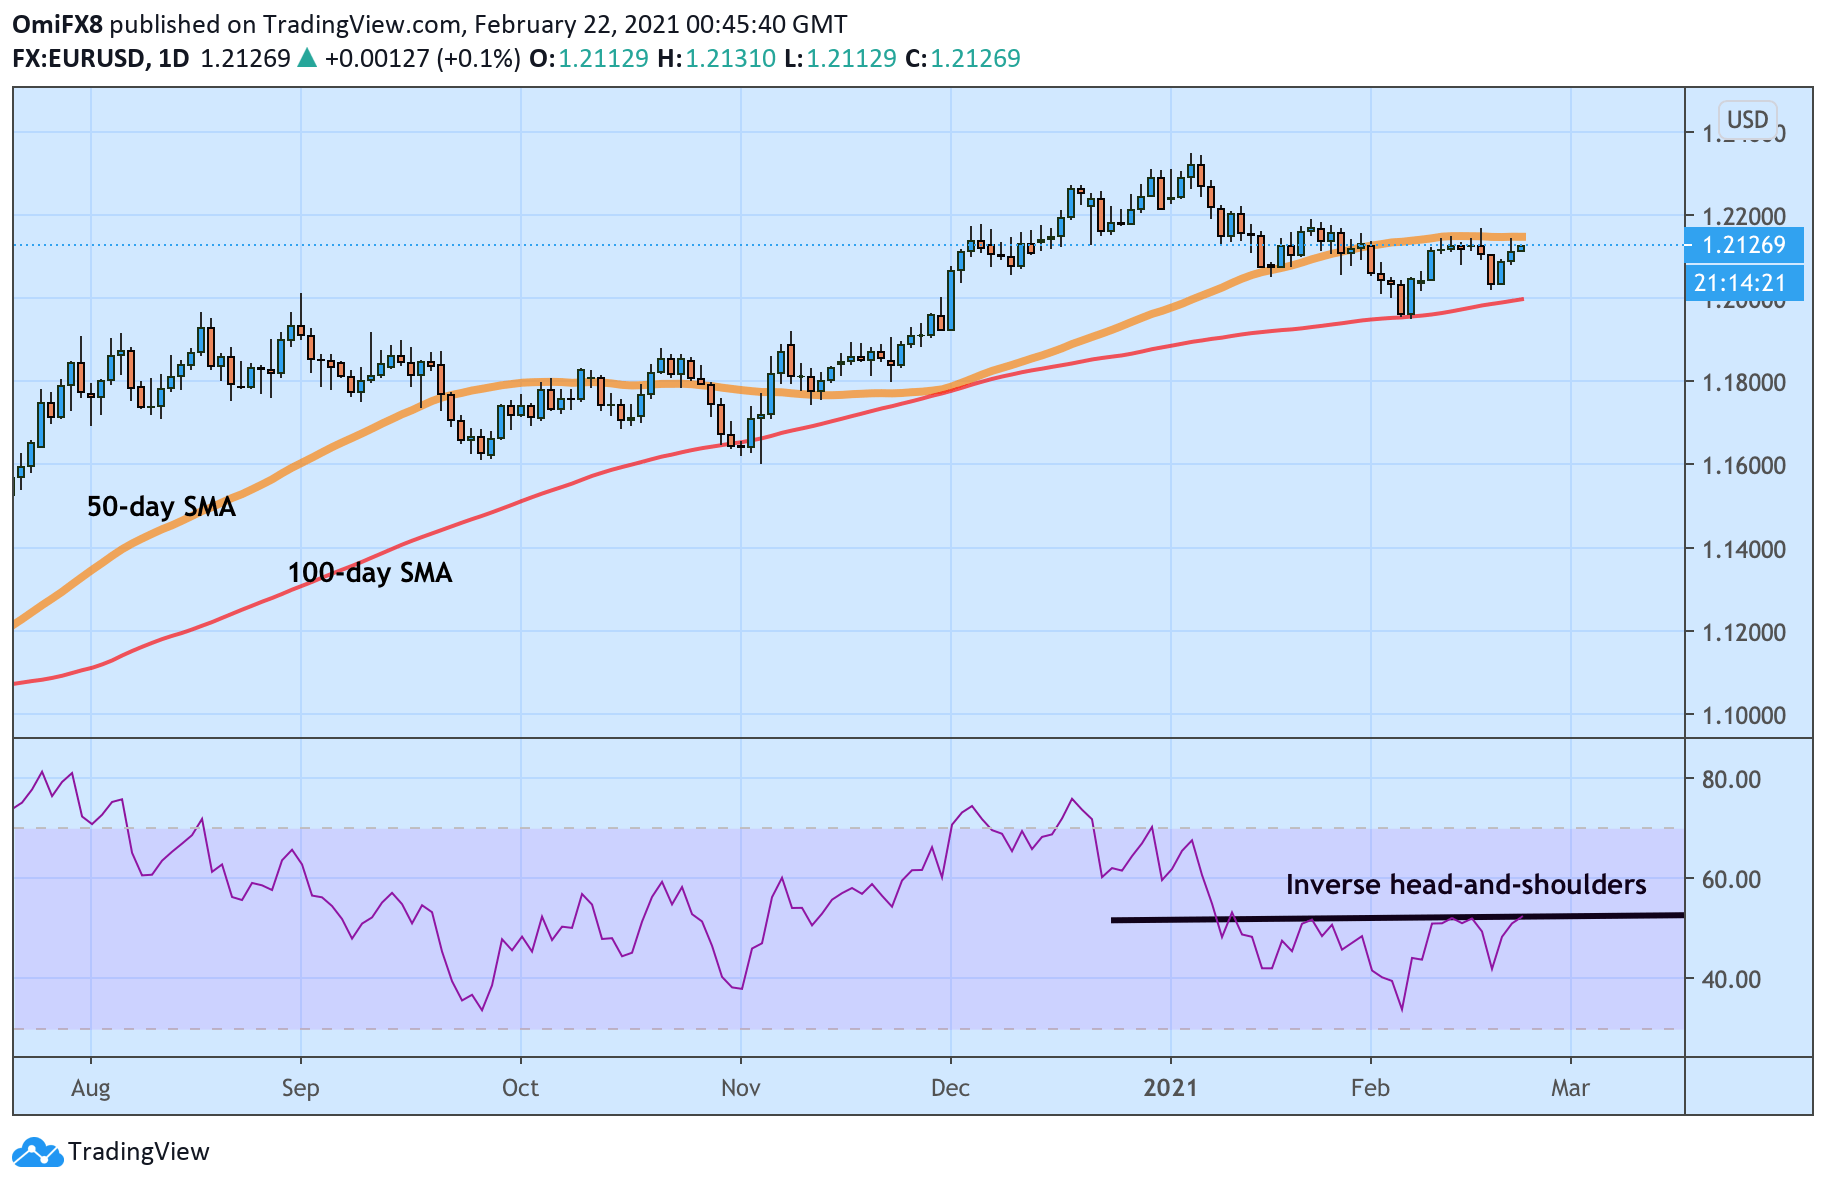
EUR/USD’s 14-day Relative Strength Index (RSI) has carved out an inverse head-and-shoulders bullish reversal pattern.
An RSI breakout would open the doors for a re-test of the January high of 1.2349. The pair is currently trading near 1.2128, representing a 0.11% gain on the day.
The pair has been restricted to a narrow range defined by the 50-day Simple Moving Average (SMA) and 100-day SMA since Feb. 4.
A close above the 50-day SMA, currently at 1.2150, would shift the focus to 1.2349. Meanwhile, a close below the 100-day SMA, currently at 1.20, would confirm a bearish reversal. The long-term SMA held ground in early November, following which the pair charted a big rally from 1.17 to above 1.23.
Daily chart
Trend: Bullish
Technical levels
