- EUR/JPY bulls rally to projected highs and forms a daily bearish W-formation.
- The price has since moved back to test a 38.2% Fibonacci retracement at prior resistance.
EUR/JPY was one of the watchlists picks for the week in a technical analysis and price projection illustrated in the following article:
The Watch List: Gold, USD/JPY, AUD/USD, EUR crosses and many more
Subsequent to the original analysis, the test of the 128 figure and projected price action to the target was documented as follows:
EUR/JPY Price Analysis: Bulls step-up to the plate, breaking the 128 hurdle
Prior analysis
4-hour chart
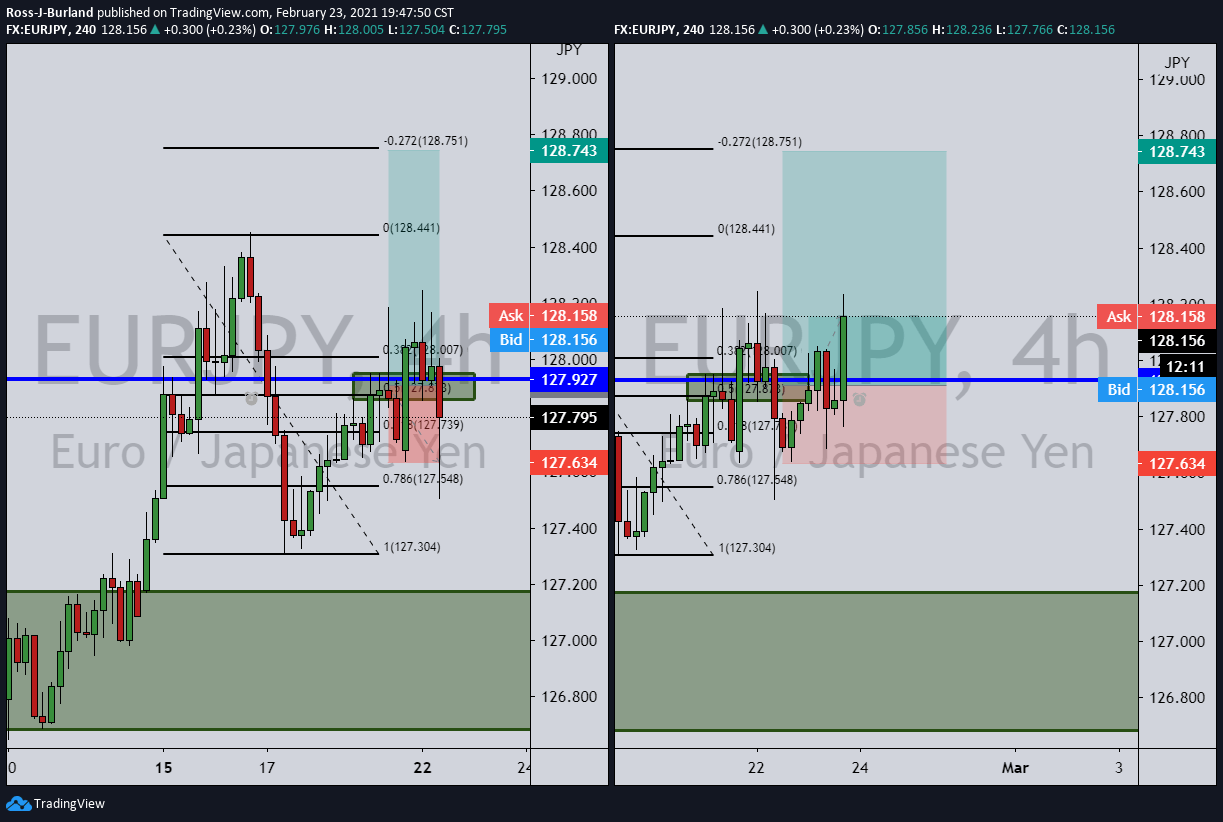
The above chart illustrates attempt 1 (1R loss) and attempts 2, which has now moved above the prior closing highs for a breakeven worst-case scenario by moving the stop loss to the entry point.
At this juncture, the upside is limited to the target and the downside is limited to 1R loss on a compounded position.
One would caution about moving the stop loss any higher considering that the W-formation is a bearish chart pattern and a correction to at least the neckline to test old resistance would now be expected.
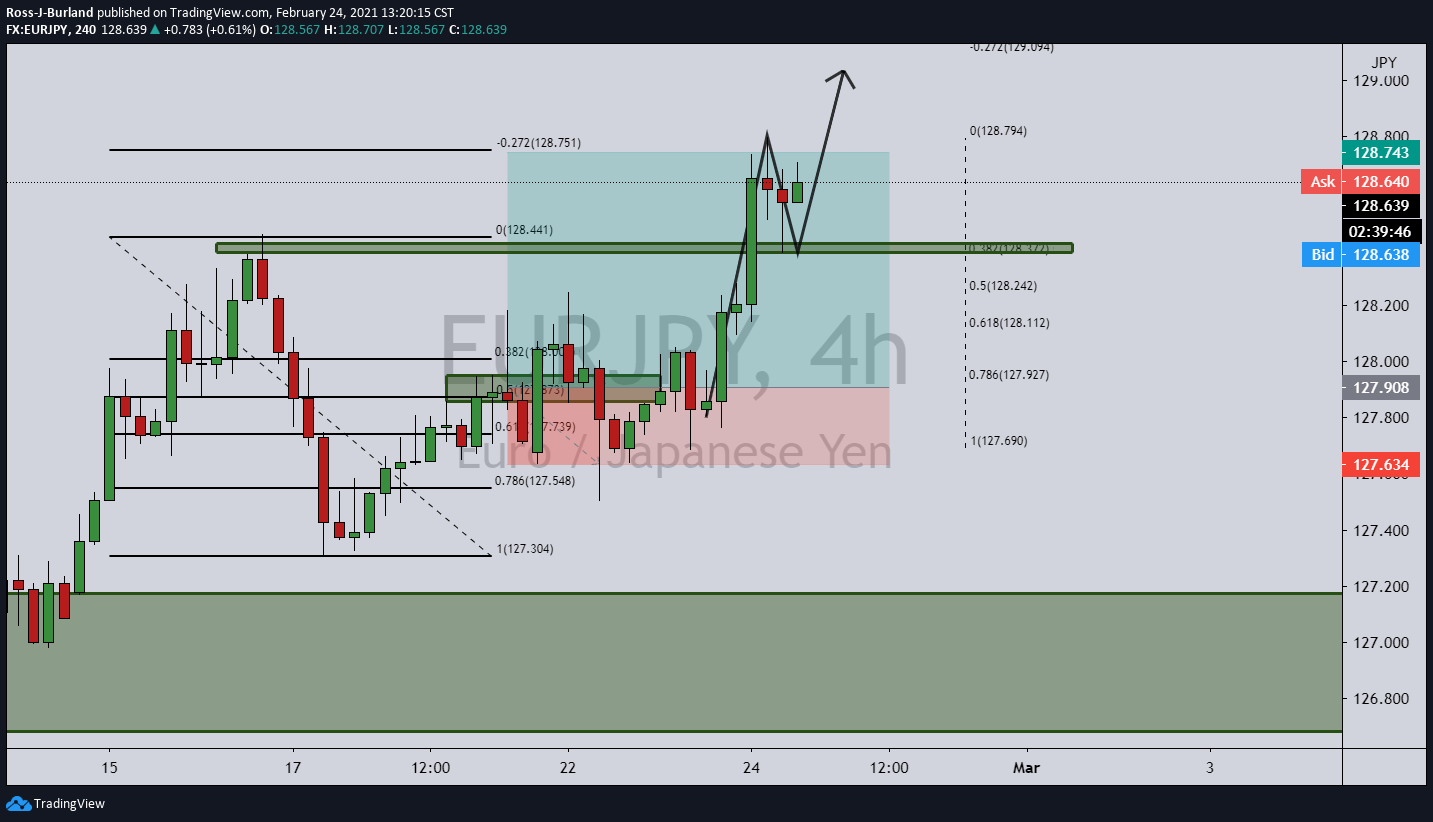
Live market, 4-hour chart
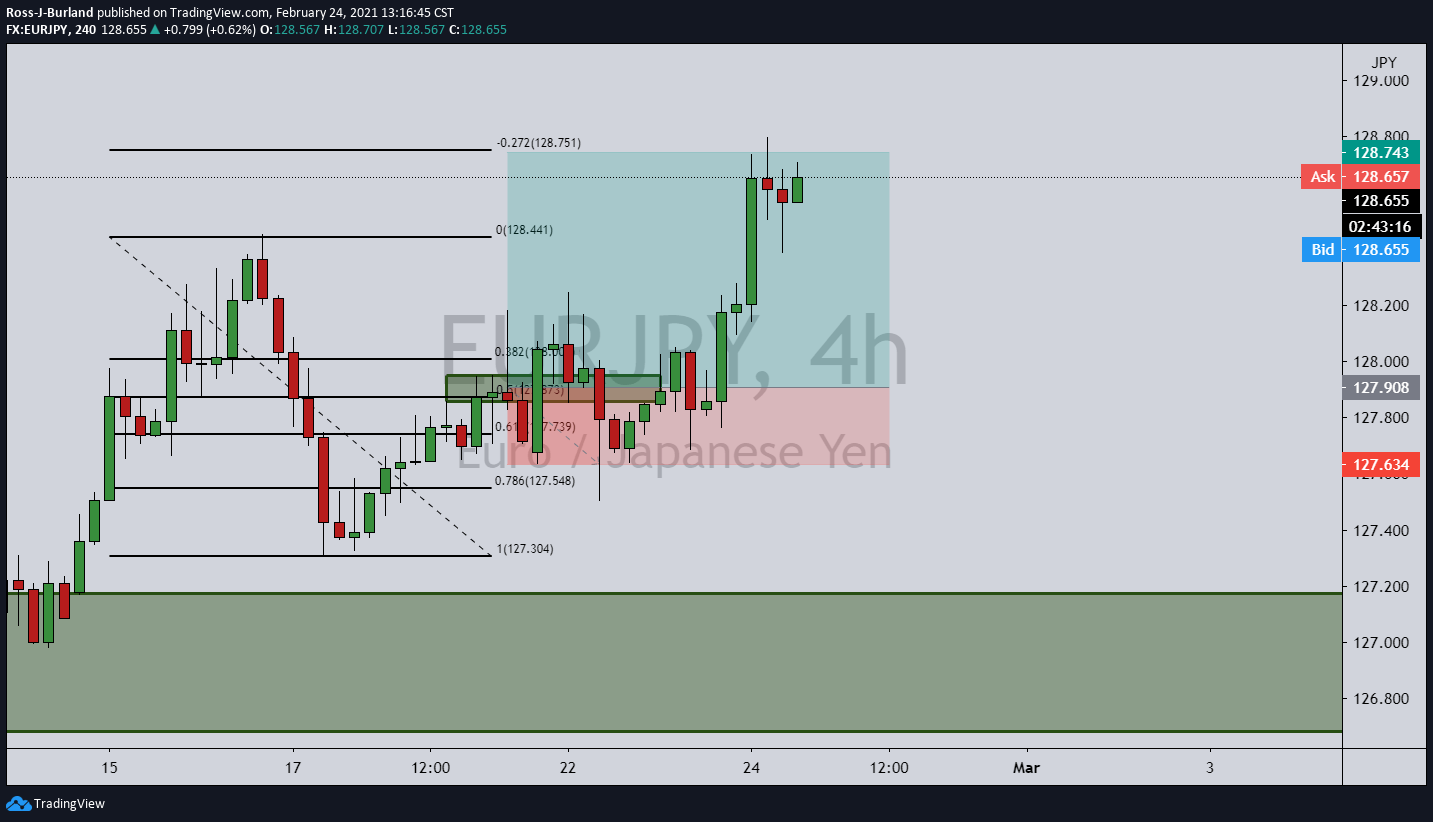
As seen, the price extended to the target and now consolidates.
However, it has since moved back to test a 38.2% Fibonacci retracement at prior resistance and remains in a bullish environment which gives rise to the prospects of an upside continuation:
However, the daily chart’s bearish M-formation is problematic and hamstrings the prospects of an immediate continuation.
Daily W-formation
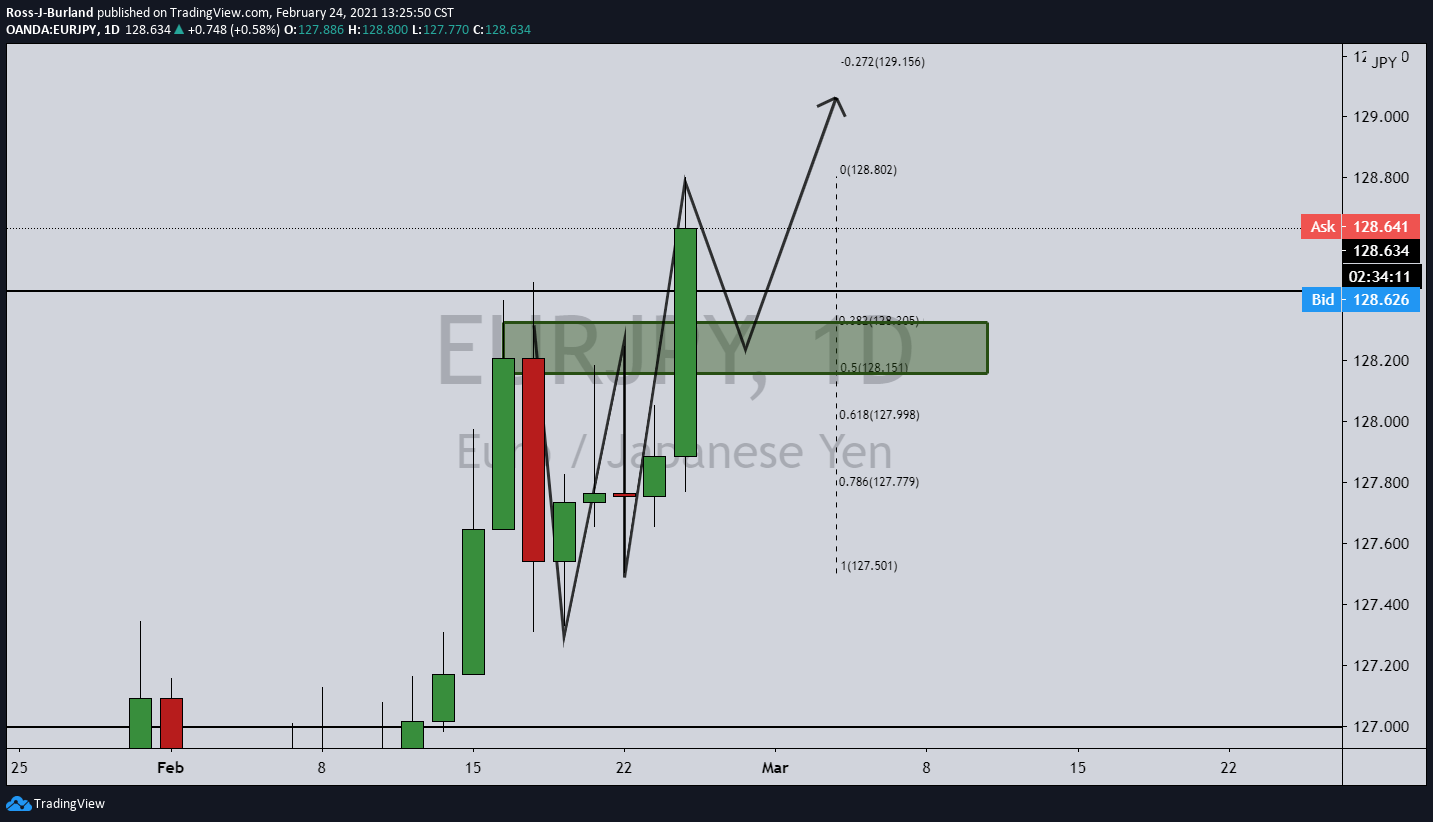
While a continuation is without a doubt possible, a downside correction from a daily perspective is more convincing at this juncture in order to fully test the daily resistance between a 50% mean reversion and the 38.2% Fibo.
