- Silver prices consolidate latest losses while staying beyond 21-day SMA for one month.
- Seven-week-old horizontal resistance, monthly falling trend line guard immediate upside.
- 50-day SMA, ascending support line from November add filters to the downside.
- Bearish MACD, strong resistance to the north and US dollar gains keep sellers hopeful.
Silver picks up bids to $27.45 during the initial Asian session trading on Friday. The white metal rose beyond $28.00 before declining to $27.35 the previous day. Even so, 21-day SMA continued on its role of strong short-term support since late-January.
It should, however, be noted that the bearish MACD signals and nearness to the key resistance confluence, including multiple highs marked since January 06 and a downward sloping trend line from February 01, challenge the silver bulls. Also on the negative side is the latest US dollar bounce off a seven-week low amid marked havoc led by the Treasury yields.
Hence, the quote’s further upside depends upon how well it can break the $28.00 resistance, which in turn needs validation from the weekly top of $28.33 before challenging the monthly high near $30.06.
Meanwhile, a downside break of 21-day SMA, at $27.28 now, will be probed by a 50-day SMA and an ascending support line from early January, respectively around $26.50 and the $26.00 threshold.
In a case where the precious metal drops below $26.00, the yearly bottom surrounding $24.20 may gain the market’s attention.
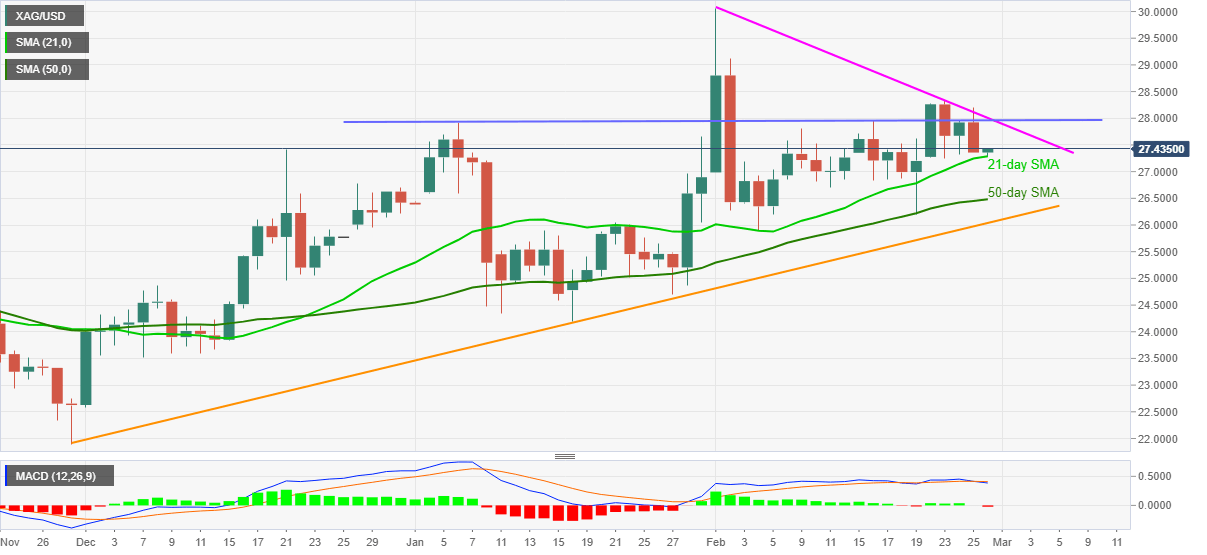
Silver daily chart
Trend: Sideways
