- GBP/USD bounces off intraday low, keeps the break of crucial support convergence.
- RSI has room for further downside but eight-day-old horizontal support tests short-term sellers.
- Bulls need validation from 1.4080-85 before retaking the controls.
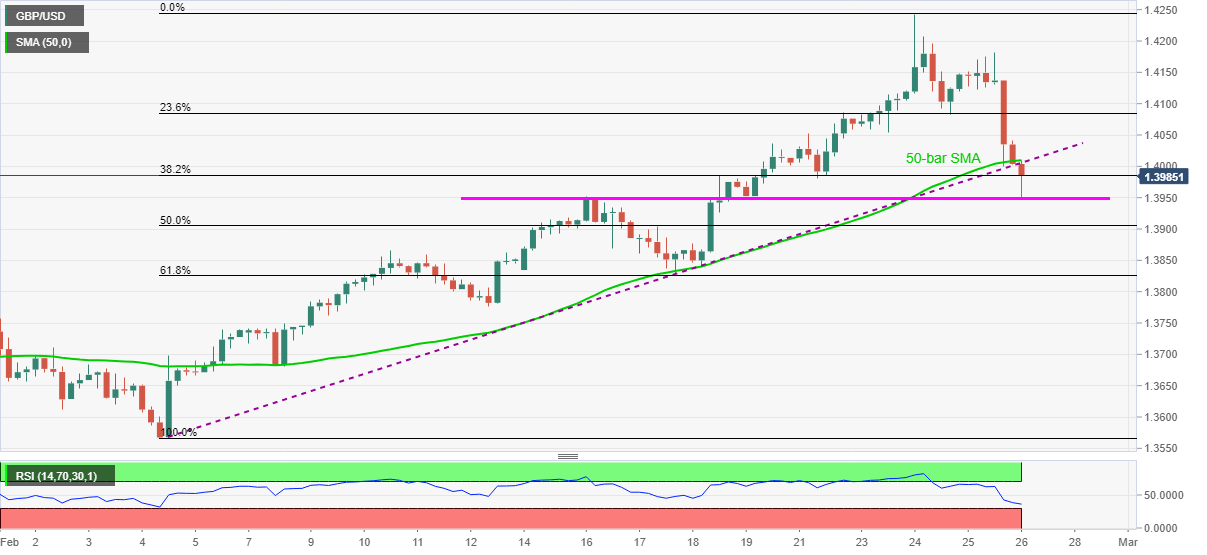
GBP/USD licks its wounds around 1.3985, down 0.12% intraday, during early Friday. The cable dropped to the lowest in a week following its downside break of 50-bar SMA and an ascending trend line from February 04.
Although the mid-month top recently probes GBP/USD sellers, sustained break of the key support convergence and a lack of oversold RSI signal further downside by the pair.
As a result, the sterling bears can target the 61.8% Fibonacci retracement level of February 04-24 upside, near 1.3825, if it manages to break the 1.3950 immediate support.
During the fall, the 50% Fibonacci retracement level around the 1.3900 threshold also offers a breathing space to the GBP/USD prices.
Meanwhile, an upside break of 1.4010 needs to cross 23.6% Fibonacci retracement level near 1.4085 to regain the buyers’ confidence.
Following that, 1.4180 and the latest top near 1.4245 will be the key to watch.
Overall, GBP/USD is up for consolidating the latest gains.
GBP/USD four-hour chart
Trend: Further weakness expected
