- GBP/USD witnessed some heavy selling for the second consecutive session on Friday.
- The bias seems to have already shifted in favour of bearish traders amid stronger USD.
- Any bounces towards the 1.3855-60 region might still be seen as a selling opportunity.
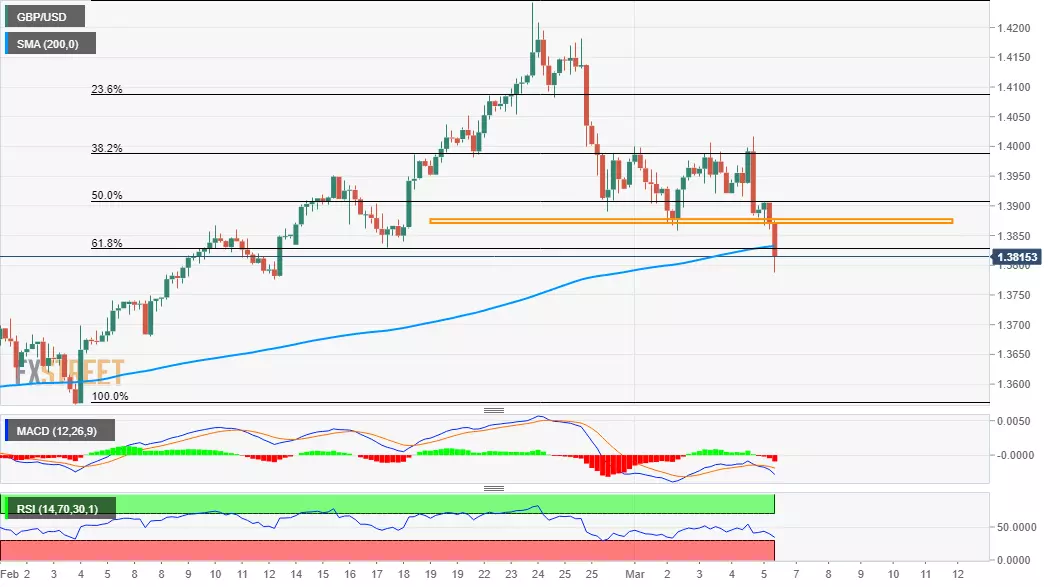
The GBP/USD pair witnessed heavy selling for the second straight session on Friday and extended the previous day’s retracement slide from levels beyond the key 1.4000 psychological mark. The downward momentum dragged the pair to below the 1.3800 mark, or three-week lows during the mid-European session.
Sustained weakness below the previous weekly swing lows, around the 1.3860-55 region, was seen as a key trigger for bearish traders and aggravated the bearish pressure. A subsequent slide below the 61.8% Fibonacci level of the 1.3567-1.4243 strong move up might have already set the stage for further weakness.
Meanwhile, technical indicators on the daily chart have just started drifting into the negative territory and add credence to the bearish outlook. However, oscillators on hourly charts are already flashing oversold conditions and warrant some caution ahead of the closely watched US monthly jobs report (NFP).
That said, some follow-through selling below the 1.3880 region will reaffirm the negative bias. This will turn the GBP/USD pair vulnerable to accelerate the fall towards intermediate support near mid-1.3700s. The next relevant bearish target is pegged near the 1.3700 mark ahead of the 1.3665-60 congestion zone.
On the flip side, any attempted recovery back towards the 1.3855-60 support breakpoint will now be seen as a selling opportunity. This, in turn, should cap the upside for the GBP/USD pair near the 1.3900 mark, which coincides with the 50% Fibo. level and should act as a key pivotal point for short-term traders.
GBP/USD 4-hourly chart
Technical levels to watch

