- Gold is moving lower in the monthly demand area.
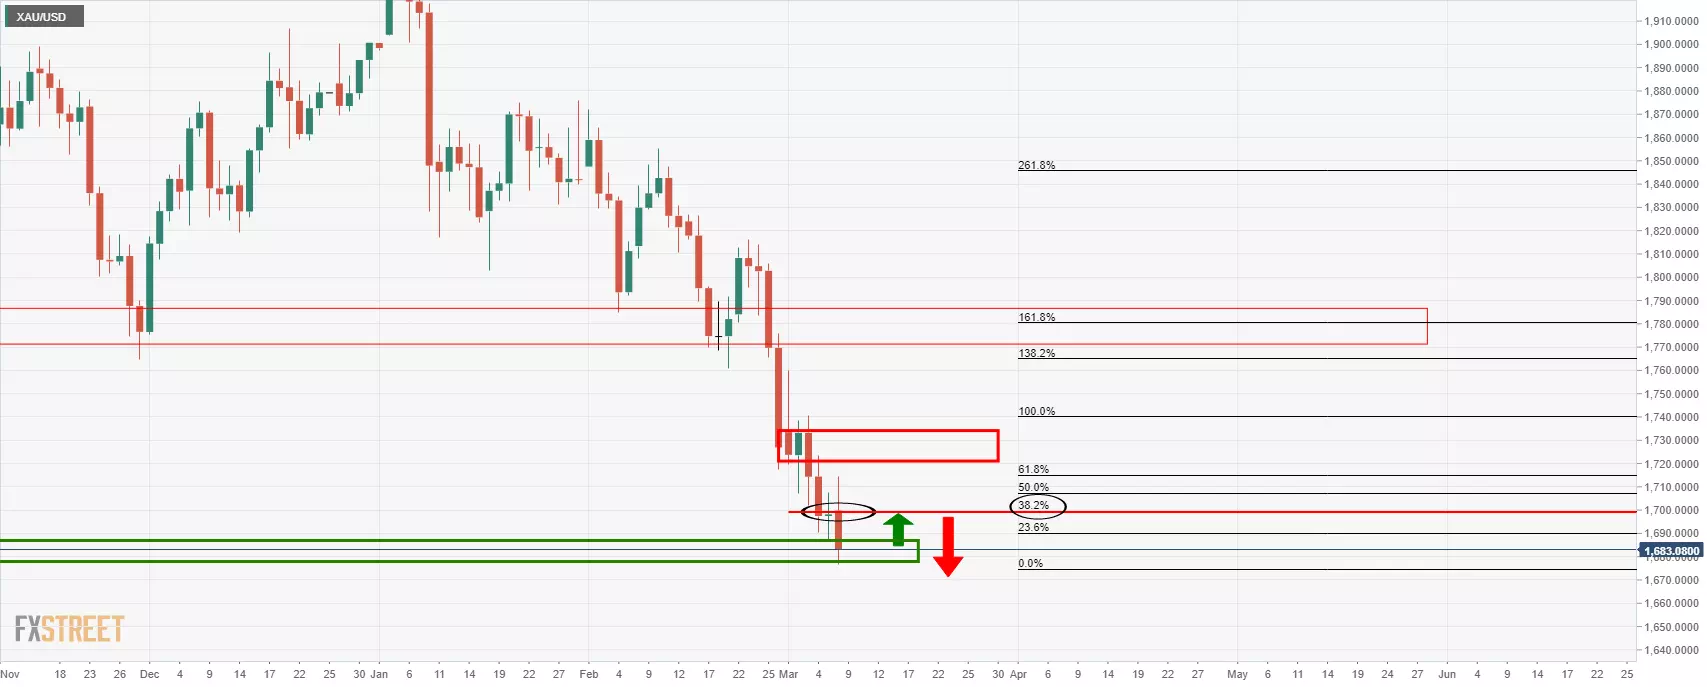
- Bulls look to a 38.% Fibo retracement of the latest bearish impulse.
The gold price has extended the downside at the start of the week printing a fresh cycle low to $1,676.91.
The following is a top-down analysis that illustrates where he next bullish opportunity could come from as the downside stalls in the monthly demand zone.
Monthly chart
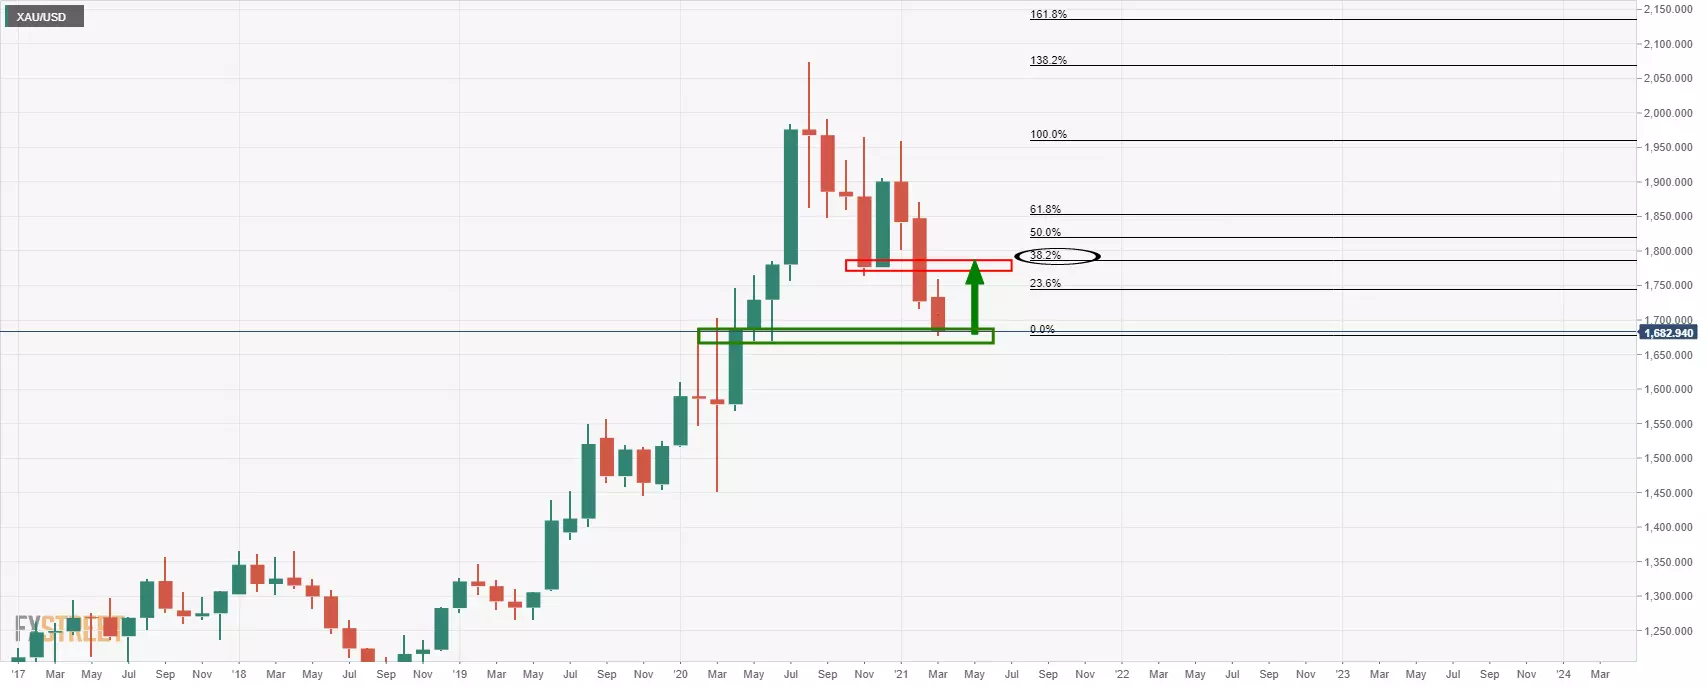
The price is now testing the bull’s commitments at the monthly demand zone which would be expected to generate a bullish correction.
Weekly chart
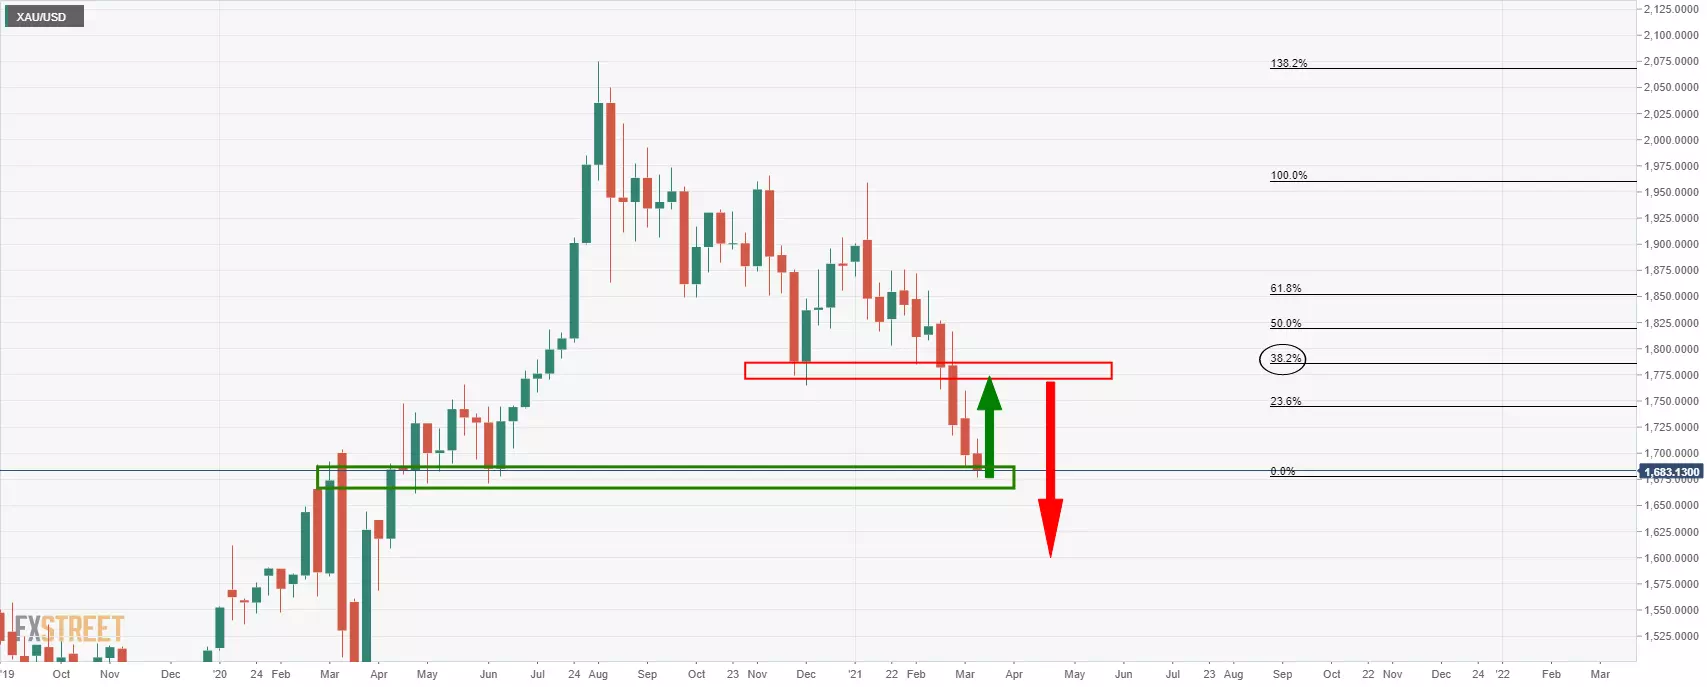
The weekly chart offers a target of confluence between the recent lows and a 38.2% Fibonacci retracement.
Daily chart
Meanwhile, however, if the price is rejected by near term resistance, there is the possibility of a deeper test into the monthly demand area.
