GBP/USD peeped above the psychological level of 1.40 early Friday, erasing 50% of the drop from 1.4241 to 1.3778 seen in the eight trading days to March 5.
The path of least resistance appears to be on the higher side, with Thursday’s green candle carrying little or no wicks – a sign the bulls controlling the price action throughout the day. Further, the 5- and 10-day Simple Moving Averages have produced a bullish crossover.
However, a pullback may precede further gains, as the hourly chart shows a bearish divergence of the Relative Strength Index.
Resistance is seen at 1.4017 (March 4 high on the hourly chart), followed by the Feb. 24 high of 1.4241. Meanwhile, support is located at 1.3932 (50-hour SMA) and 1.30 (psychological level).
Daily chart
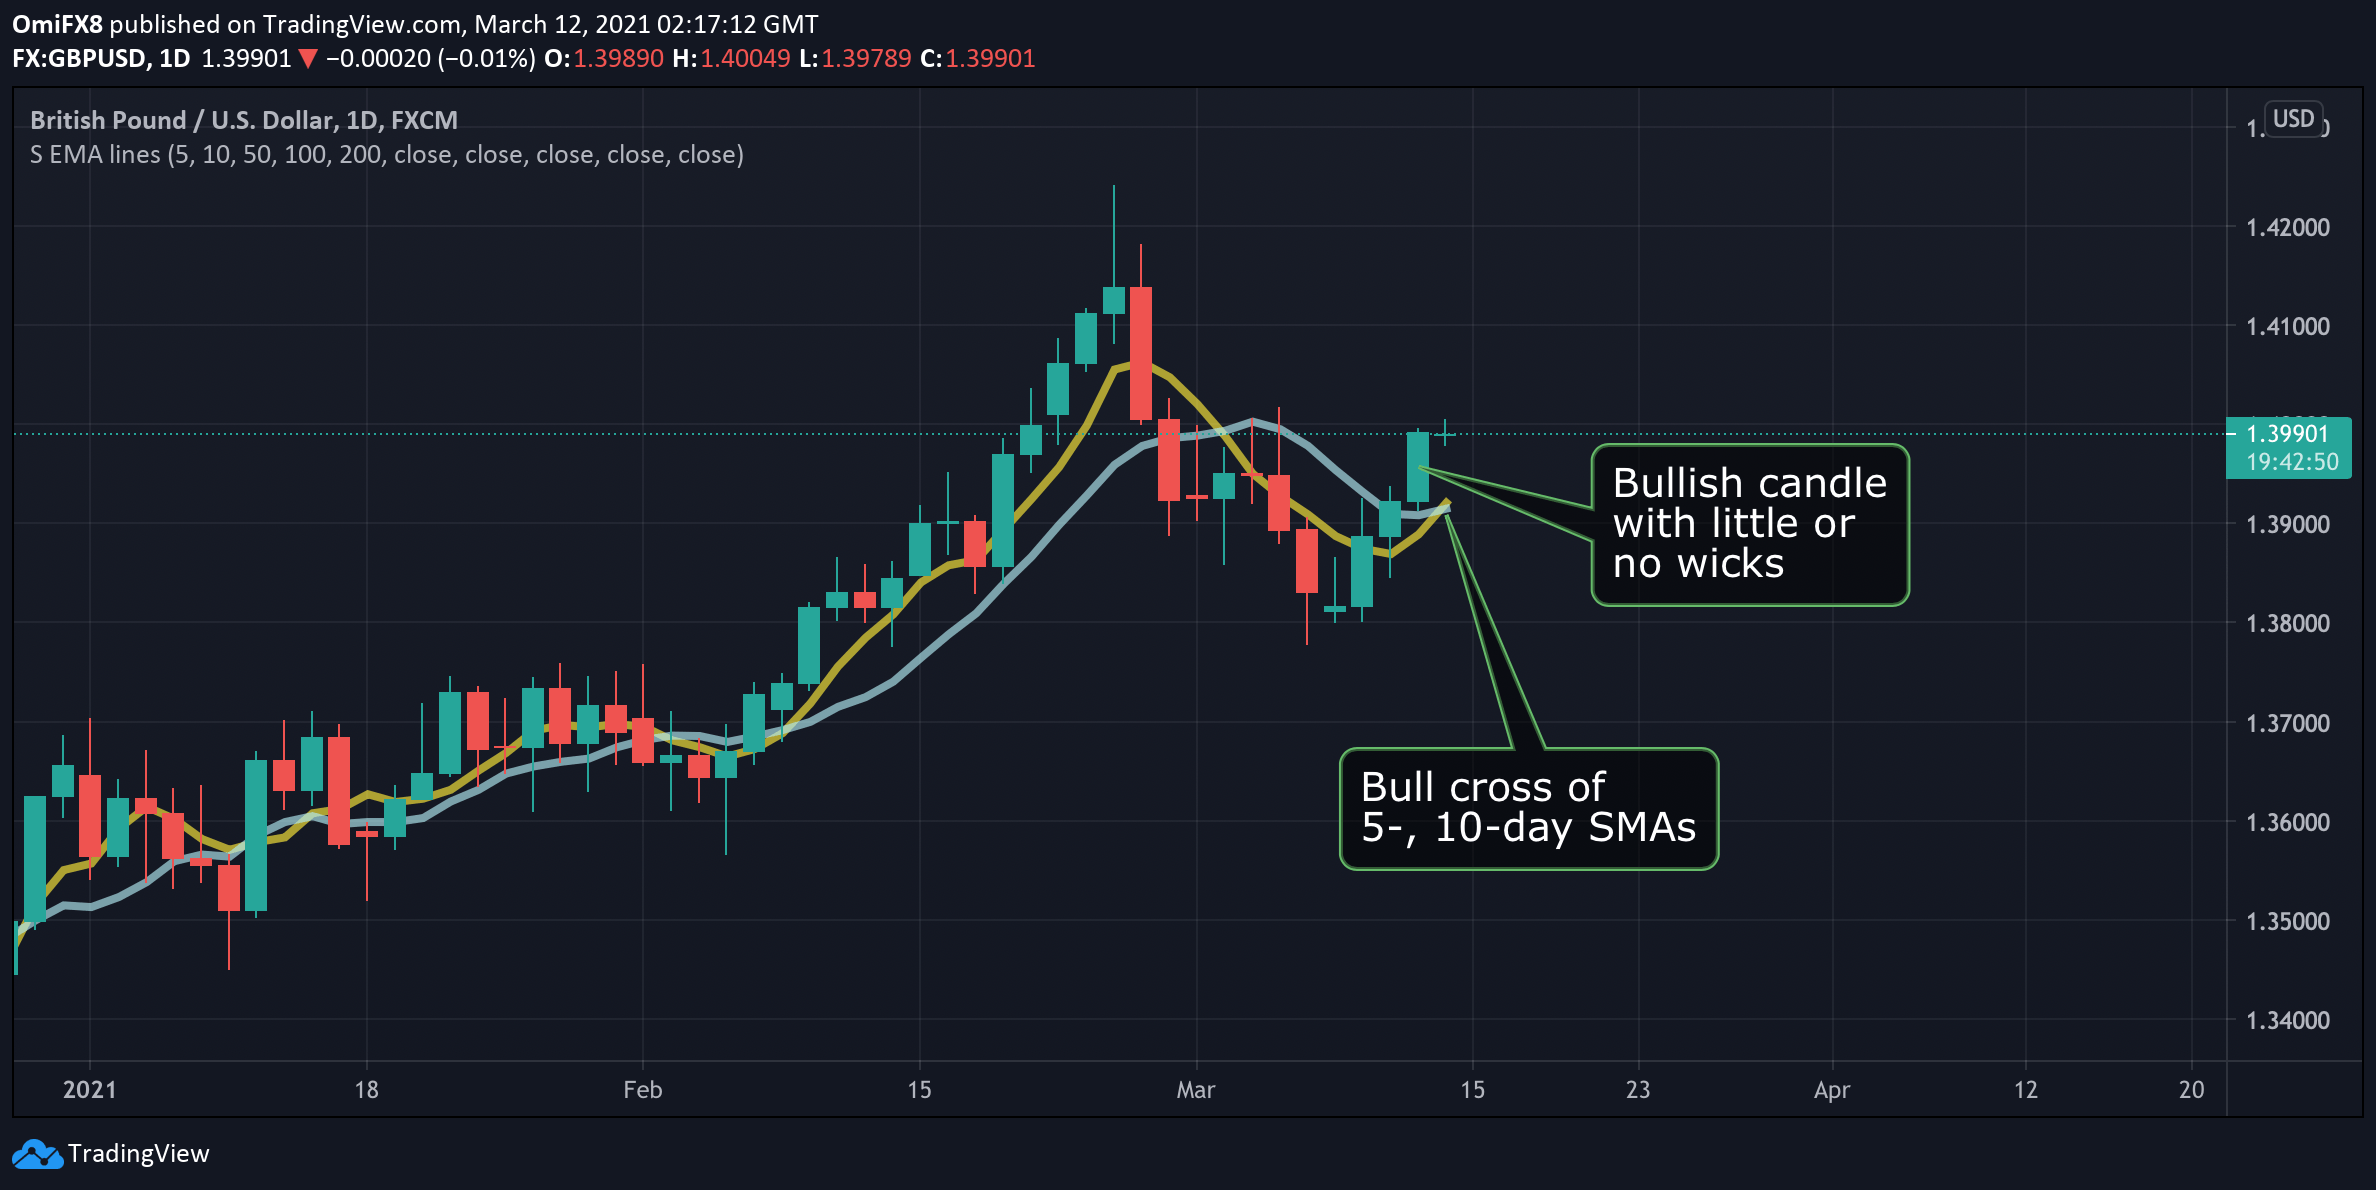
Trend: Bullish
Technical levels
